
Figure 6.
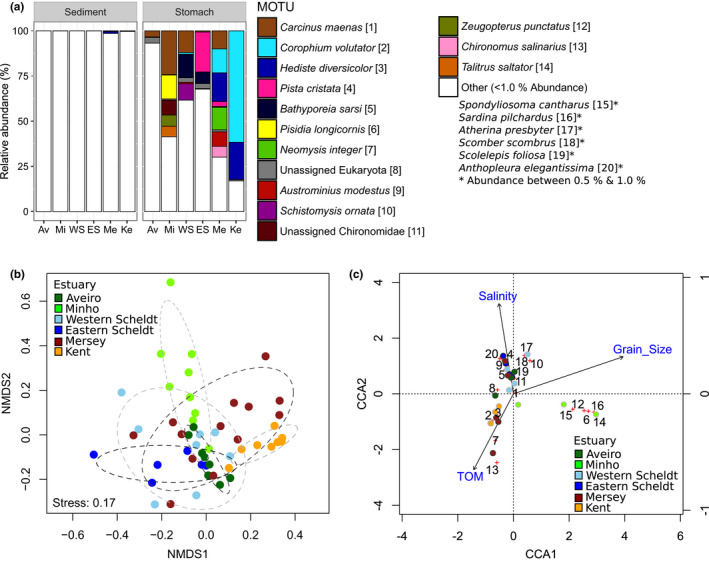
Multivariate analysis of Crangon crangon diet in six estuaries determined by COI metabarcoding based on MOTUs (N = 20) over all stomach samples (N = 53). (a) Mean relative read abundance of each MOTU per estuary based on DNA extracted from sediment and stomach samples (after removal of C. crangon and Purpureocillium lilacinum reads). MOTUs are identified for ≥1.0% average read abundance in the stomach samples, otherwise are referred as “Other”. (b) Nonmetric multidimensional scaling (nMDS) analysis based on Bray–Curtis dissimilarities of square‐root‐transformed relative abundances in C. crangon stomach samples. Each dot represents one pooled stomach sample, estuaries are identified by colours (see below), and ellipses show 75% confidence intervals. (c) Canonical correspondence analysis (CCA) of square‐root‐transformed relative read abundances in relation to salinity, total organic matter (TOM) and median grain size. Reads were averaged per site (displayed as dots) and estuaries are identified by colour (see below). Red crosses represent the MOTU scores and numbers refer to the MOTU names given in panel (a)