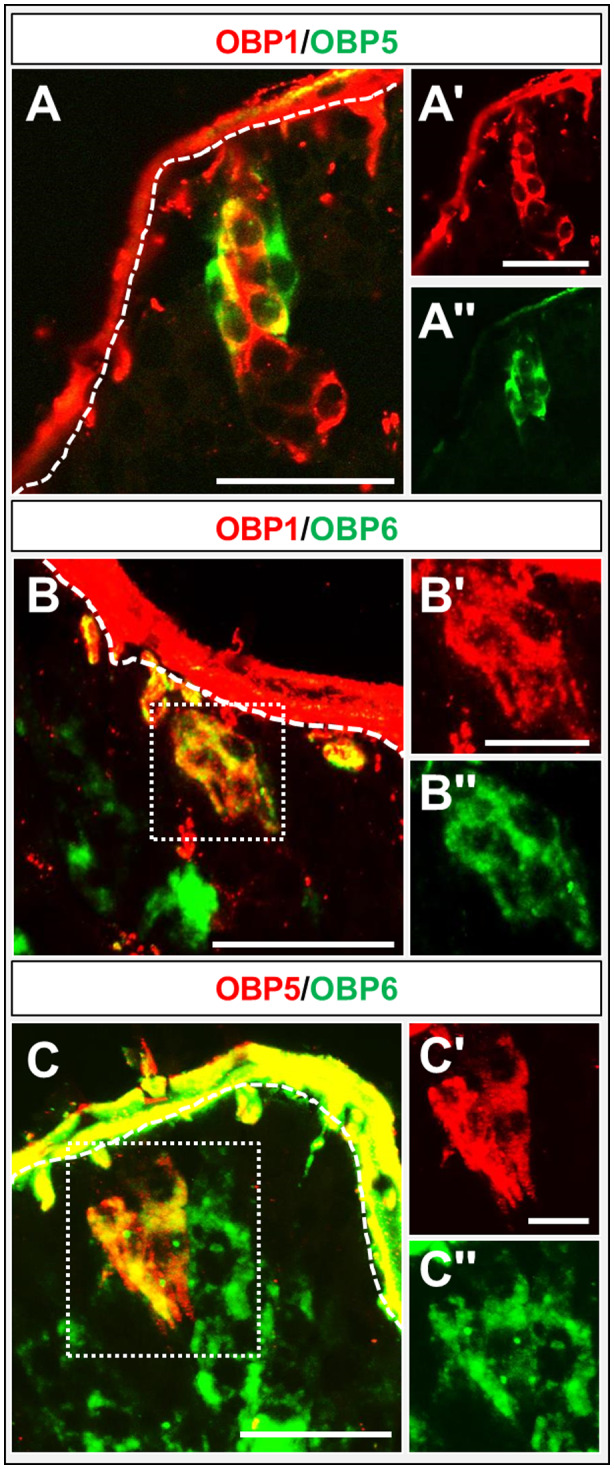
Figure 6.

Co‐expression of subfamily I‐A odorant‐binding proteins (OBPs). (A–C) Merged images of fluorescence in situ hybridization on sections of maxillary palps of Schistocerca gregaria using digoxigenin and biotin‐labelled riboprobes of subfamily I‐A. OBP‐expressing cells are depicted in red and green fluorescence. (A) A partial co‐expression of OBP1 and OBP5 is visible (yellow). (B, C) OBP1 and OBP5‐positive cells co‐express OBP6, indicated by yellow fluorescence. The white dashed line indicates the beginning of the cuticle. (A–C, A–C') Single fluorescence channel images; either the green or the red fluorescence are shown. Scale bars: A–C, A, 50 µm; B, C, 20 µm.
