
Figure 1.
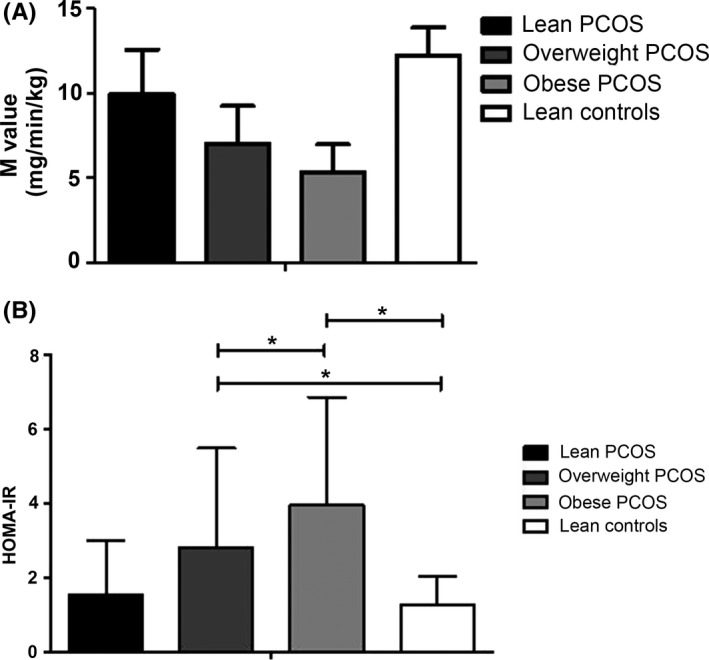
A, M value of the four groups of women. General P < 0.001; all P < 0.05 between each pair of groups. B, HOMA‐IR of the four groups of women. General P < 0.001; *P < 0.05
Official websites use .gov
A
.gov website belongs to an official
government organization in the United States.
Secure .gov websites use HTTPS
A lock (
) or https:// means you've safely
connected to the .gov website. Share sensitive
information only on official, secure websites.
A, M value of the four groups of women. General P < 0.001; all P < 0.05 between each pair of groups. B, HOMA‐IR of the four groups of women. General P < 0.001; *P < 0.05