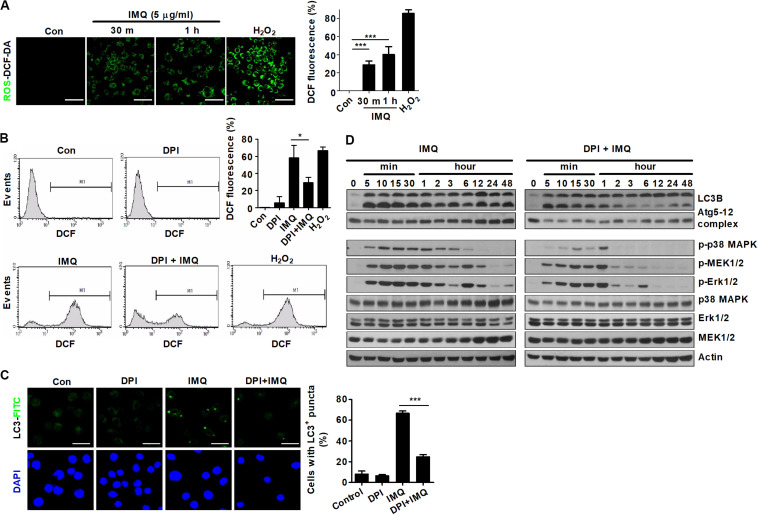
FIGURE 4.
ROS are responsible for the early induction of autophagy in IMQ-treated cells. Intracellular ROS levels were determined by the intensity of DCF fluorescence using (A) confocal microscopy or (B) flow cytometry. (A,B) The bar graph represents the percentage of DCF fluorescence intensity. (C,D) Raw264.7 cells were pretreated with DPI and then treated with IMQ. LC3-positive cells were observed under confocal microscopy. The bar graph represents the percentage of cells with LC3+ puncta. (D) Western blots were performed with antibodies against each protein. Data are the means ± s.d. of three technical replicates and are representative of at least three independent experiments. Images are representative of at least three independent experiments. Statistical significance is indicated as *p < 0.05 and ***p < 0.001.

