FIGURE 7.
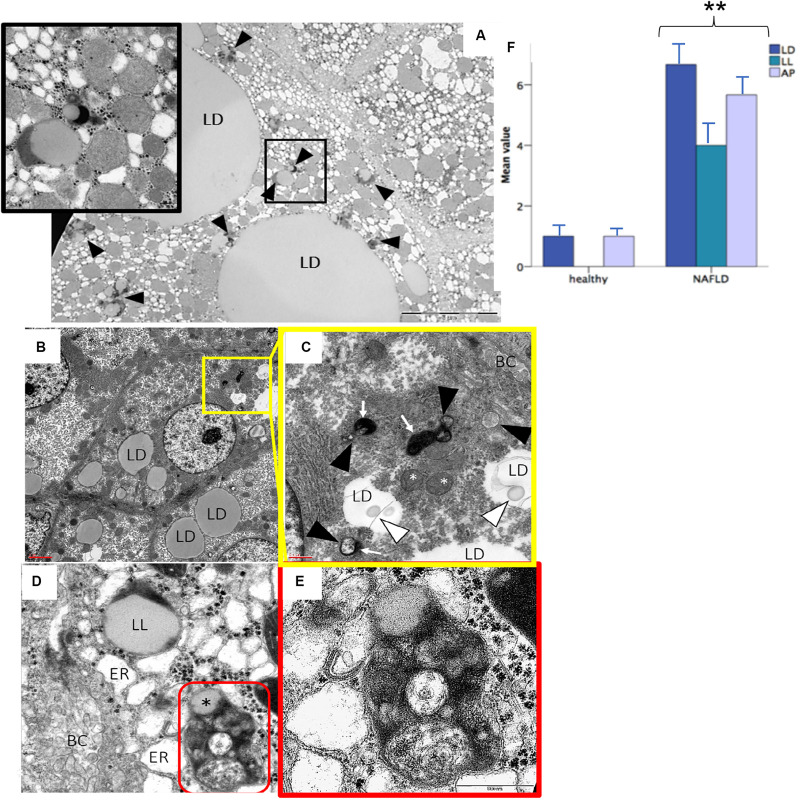
Transmission electron microscopy analysis confirmed the presence of lipolysosomes with dense lipid core and typical electron-dense lysosomal membrane in fatty liver (A–D). The different cellular organelles involved in the autophagic process phases are depicted in the high power fields (C,E). Bars representing the number of autophagic organelles in NAFLD patients compared to healthy subjects (mean values, n = 5) (F). LD, lipid droplet; LL, lipolysosome; AP, autophagosome; ER, stressed endoplasmic reticulum; BC, bile canaliculus; red circle, autolysosome; white arrowhead, phagophore; black arrowhead, immature autophagosome; white arrow, lysosome; white asterisk, stressed mitochondria; black asterisk, lipid component of autolysosome. Original magnification: 3900× (A); 2300× (B); 12000× (C,D); 46000× (E). **p < 0.05.

