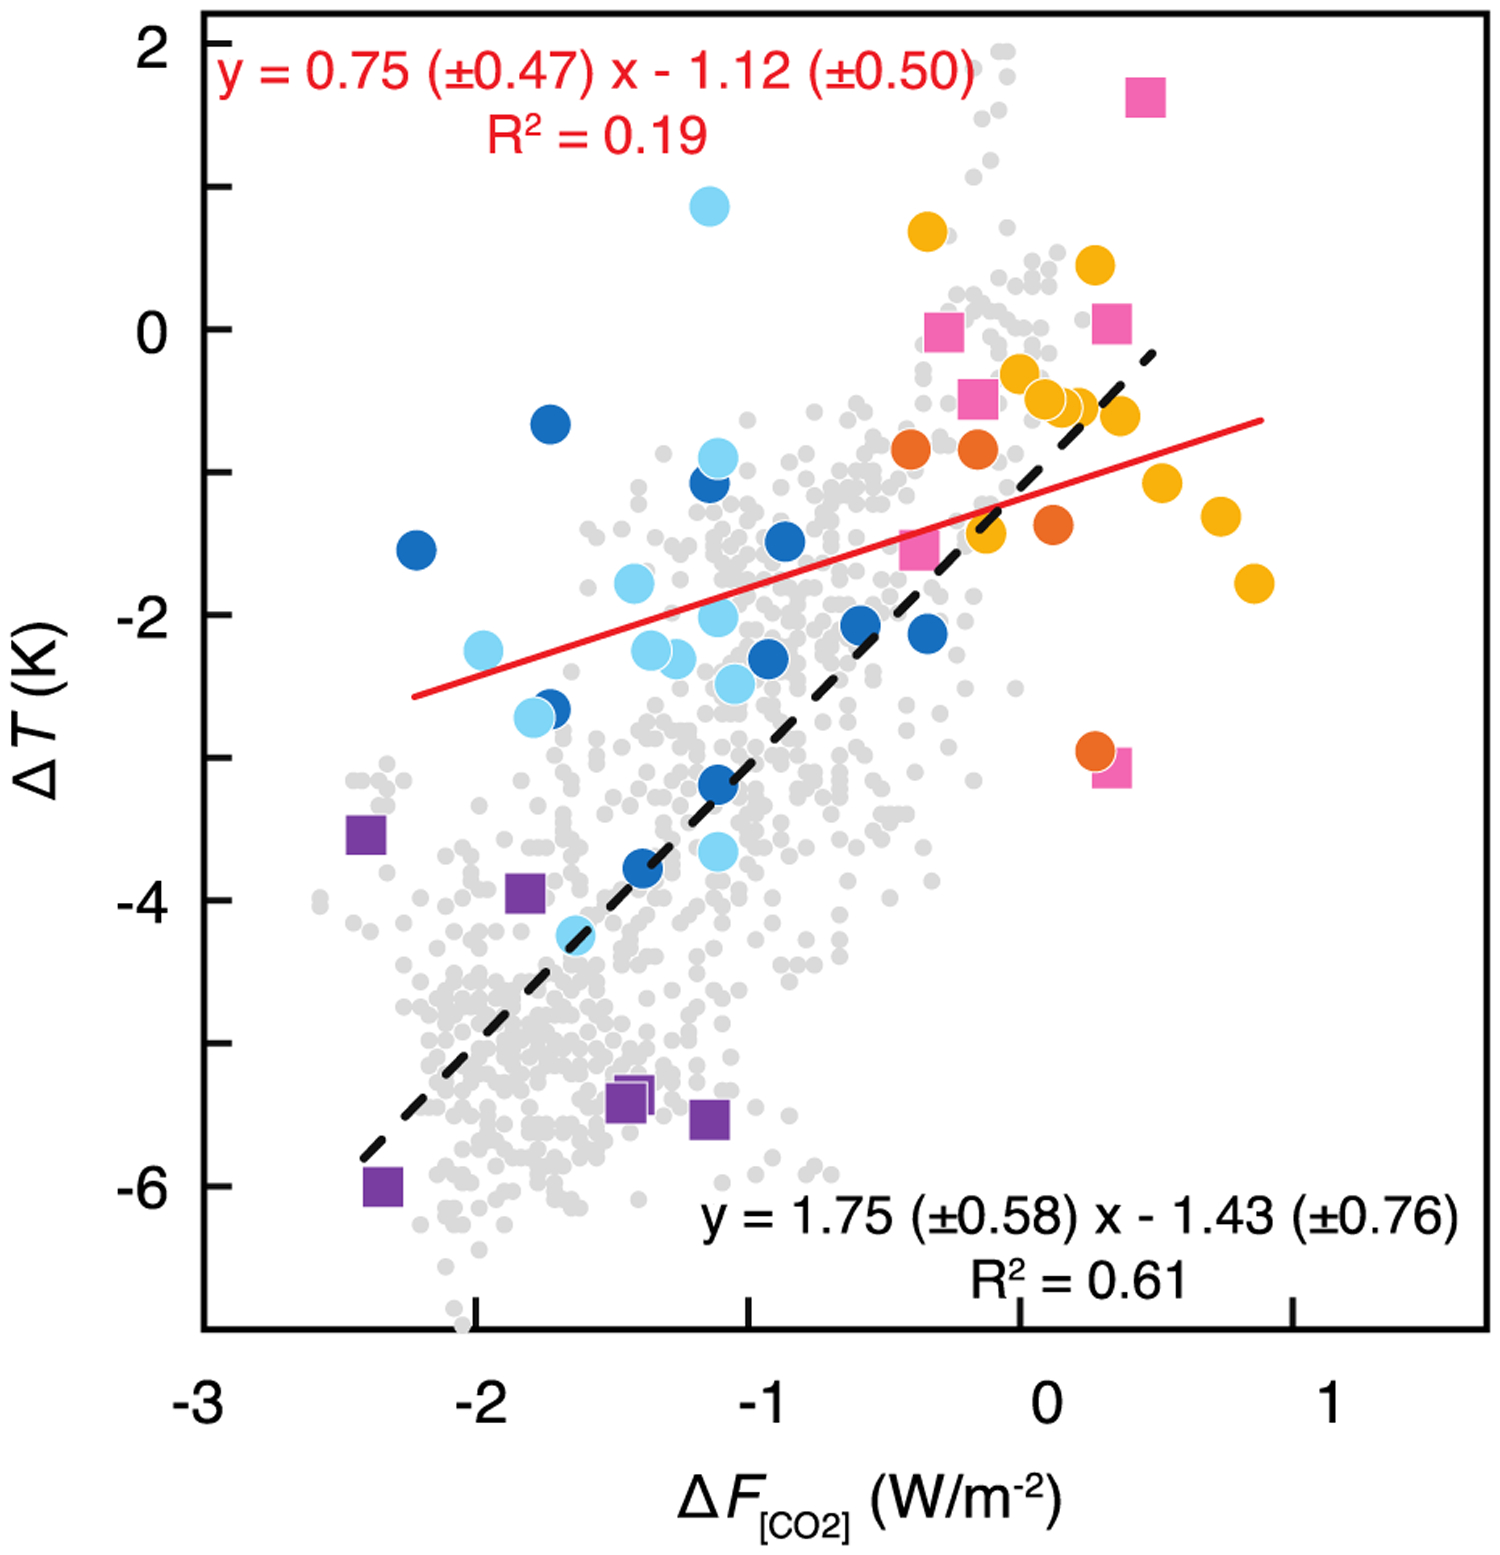
Figure 6.

Cross plot of the change in global average surface temperature [ΔT; Snyder 2016] with the change in radiative pCO2 forcing (ΔF[CO2]; calculated after Myhre et al. [1998], relative to pre-industrial pCO2 of 278 ppm). Colors are the same as in Figure 5, with fit through early Pleistocene (1.0–1.8 Ma) in red and fit through late Pleistocene data (0–0.8 Ma) in black. Note that this framework considers the contributions of other feedbacks as internal to the Pleistocene climate system.
