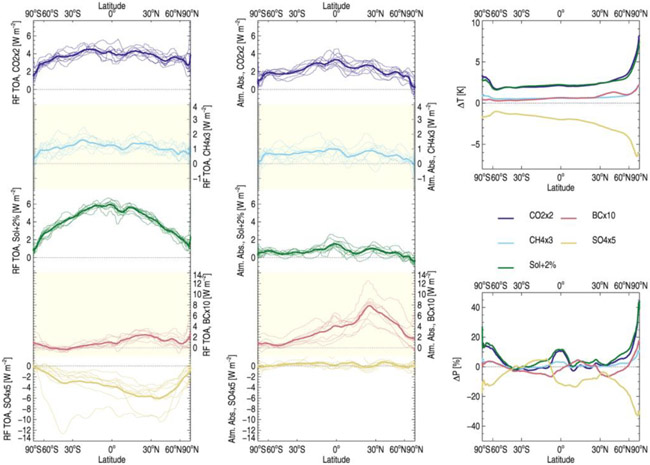
Figure 3:
Zonal and annual mean radiative forcing, atmospheric absorption, surface temperature change, and precipitation change for the five PDRMIP drivers. The left hand panel shows the zonal-annual mean top-of-atmosphere radiative forcing for the five PDRMIP drivers (from top bottom: CO2 in blue, CH4 in cyan, solar in green, BC in red and SO4 in yellow); the individual models are shown (thin lines), in addition to the multi-model mean (thick lines). The middle panel shows the same but for atmospheric absorption. The right hand panels show the surface temperature (top) and precipitation changes (bottom) for the multi-model mean for all five drivers (following the color coding from the left and centre panels). Radiative forcing and atmospheric absorption are diagnosed from the fixed-SST simulations.

