
Fig. 6.
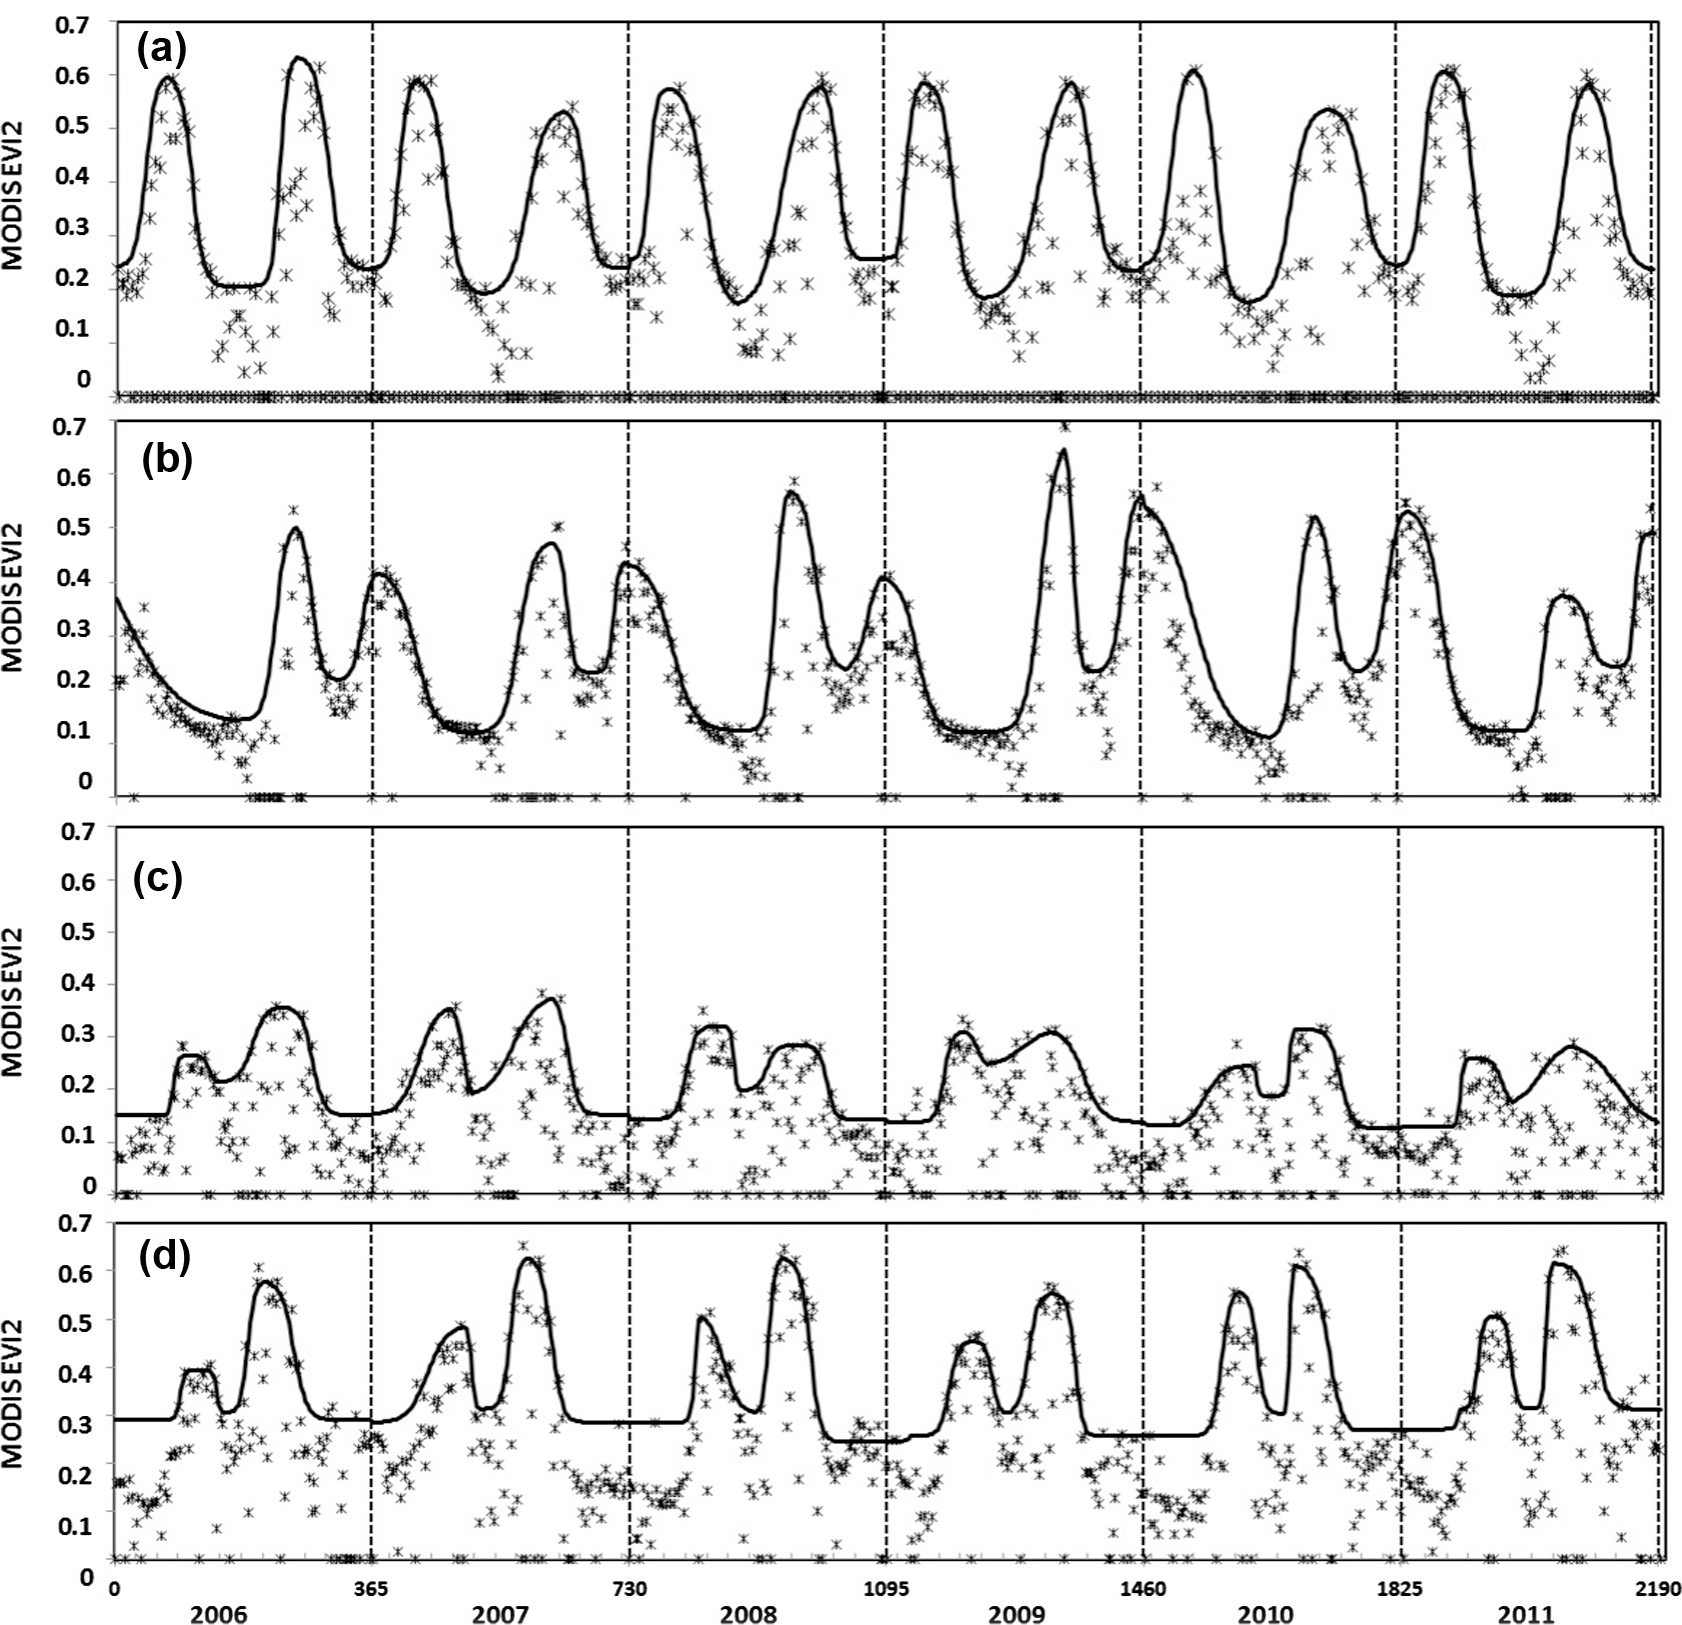
Resconstructed temporal trajectory of MODIS EVI2 in double cropland fields (randomly selected pixels). (a) Telangana in India (e.g. double rices), (b) Madhya Pradesh in India (e.g. maize and wheat or rice and wheat), (c) central China (double rices), (d) northern China (wheat and maize). The solid dark lines are reconstructed EVI2 trajectories while the asterisks are original values. All missing observations and negative EVI2 are set to zero. X-axis is the number days from Janurary 1, 2006 (upper) and year (bottom).