
Figure 3. CIRI applied to chronic lymphocytic leukemia.
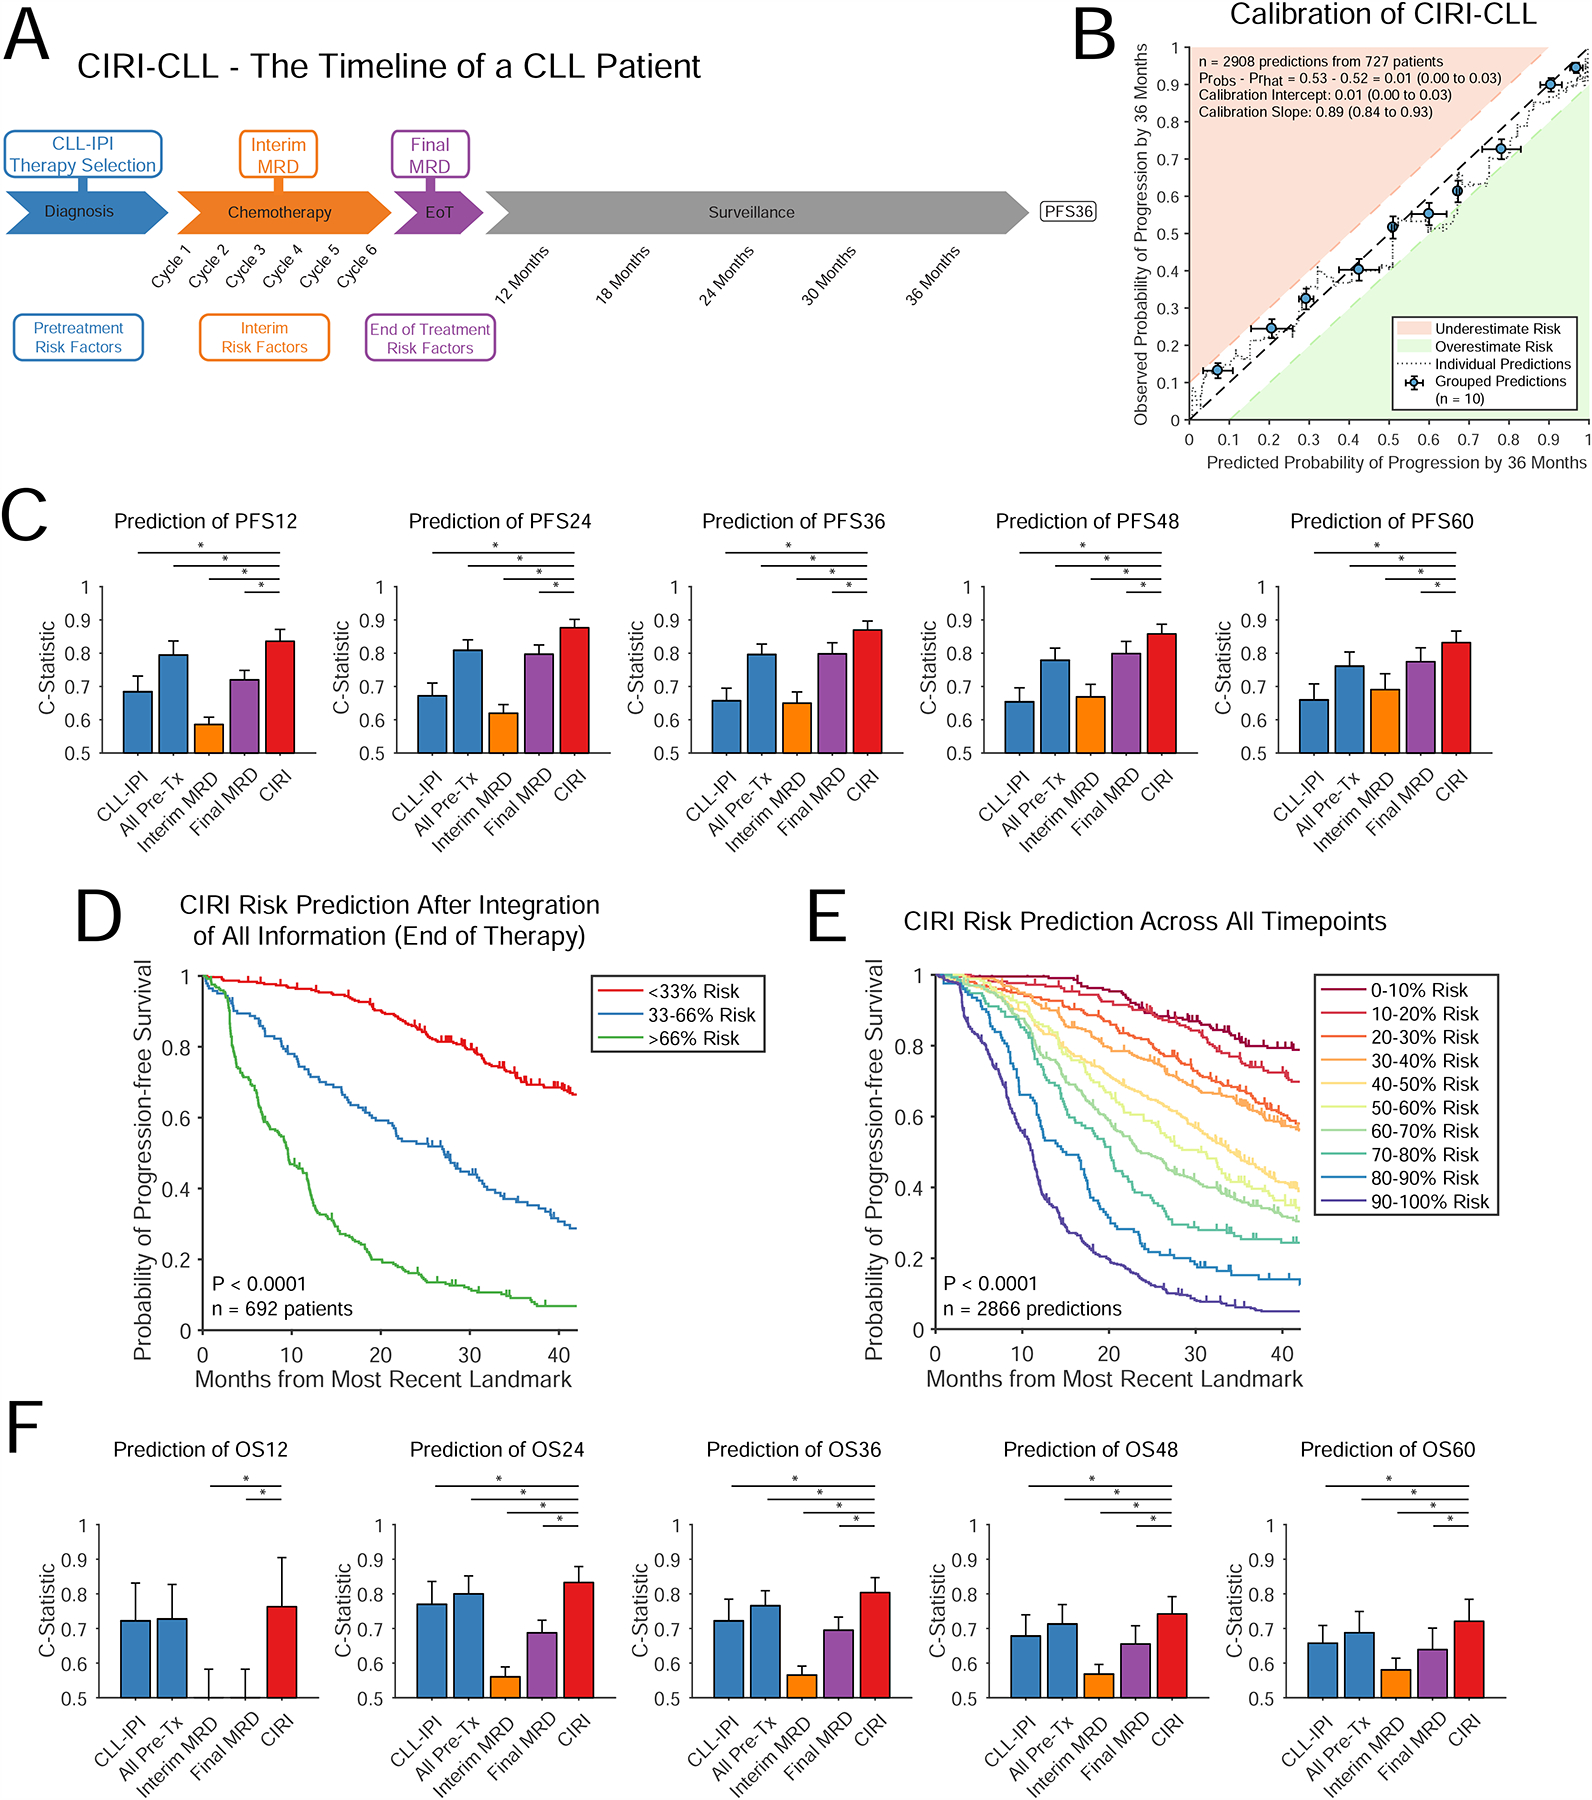
A) The course of a patient with CLL through therapy and surveillance is shown. Pretreatment risk factors (shown in blue) are obtained directly prior to therapy. Interim and end of therapy risk factors (shown in orange and purple) are obtained throughout a course of therapy, before the eventual clinical outcome (PFS36). B) Similar to Fig 2B, the displayed plot demonstrates the calibration of predictions from CIRI-CLL with observed patient outcomes across predictions from all time-points. C) Bar plots demonstrates the C-Statistic and 95% C.I. for predicting progression-free survival at various time-points using the CLL-IPI, all pretreatment risk factors, interim MRD, end of therapy MRD, and CIRI-CLL. Predictions from CIRI are made after integration of all data. D) A Kaplan-Meier estimate shows the PFS for patients stratified by CIRI-CLL risk-prediction of PFS36 split into three groups at the time of final restaging after integration of all information (i.e., at the end of therapy with knowledge of final MRD). To guard against guaranteed time bias, patients with progression prior to end of therapy MRD assessment (n=35, 5%) were excluded. E) Similar to panel D, a Kaplan-Meier estimate shows the PFS for patients stratified by CIRI-CLL. Here, risk-predictions across all time-points are shown; as many more individual risk-predictions are available, patients are split into 10-strata to demonstrate the power of this approach and model calibration at the desired endpoint (PFS at 36 months). To guard against guaranteed time bias, predictions utilizing information obtained after the progression event (n=42, 1%) were excluded. F) Bar plots demonstrates the C-Statistic and 95% C.I. for predicting OS at various time-points using the CLL-IPI, all pretreatment risk factors, interim MRD, end of therapy MRD, and CIRI. (PFS: progression-free survival; PFS36: progression-free survival at 36 months). * indicates P < 0.05. See also Figure S3.