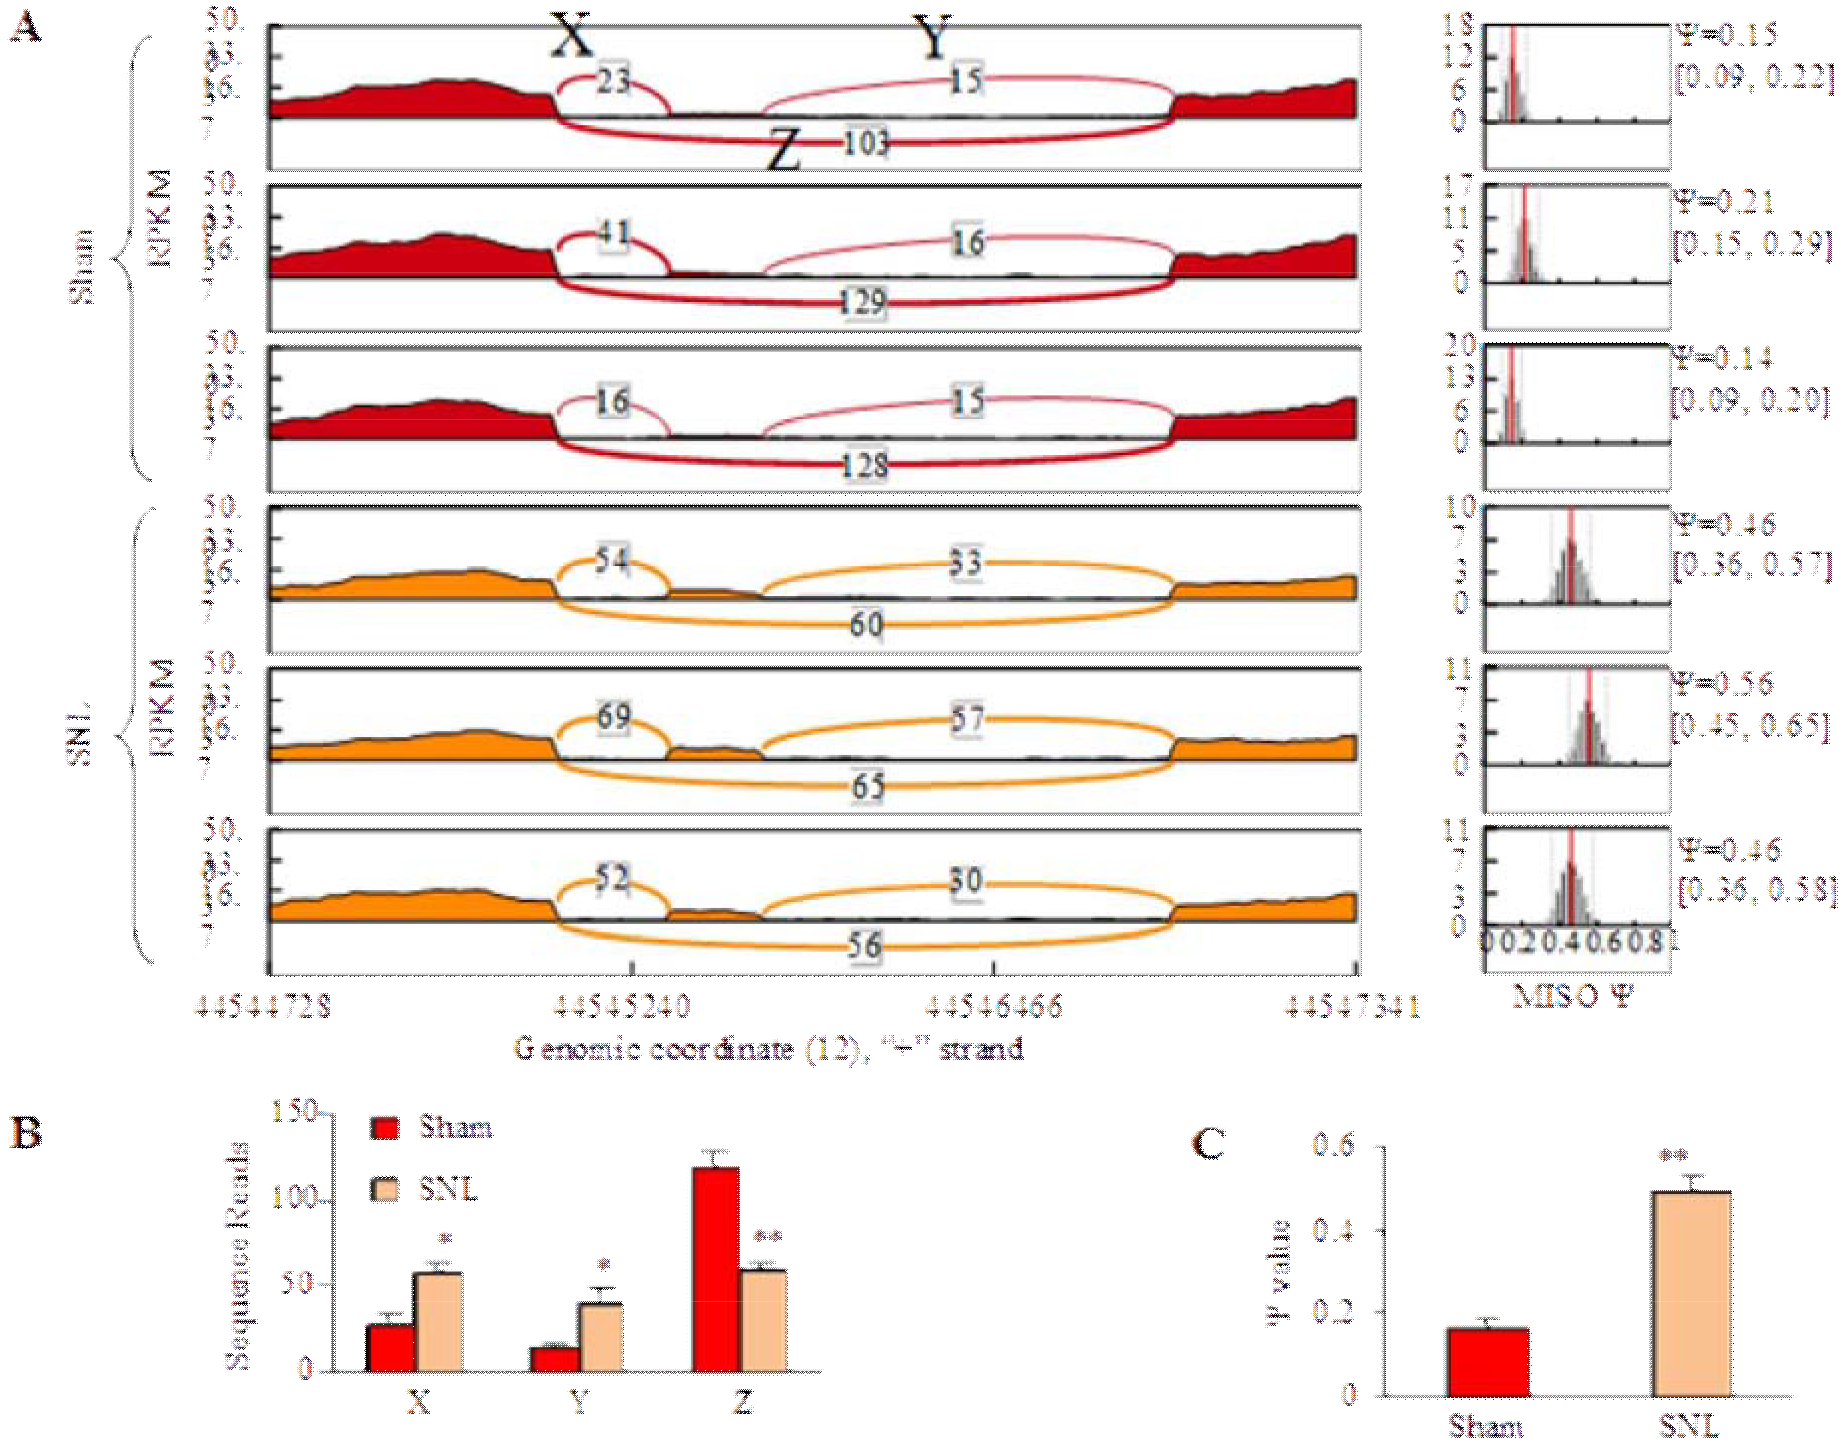
Figure 2. SNL increased exon 10 insertion.

(A) MISO model showed inclusion reads (X and Y) and exclusion reads (Z) of Nrcam exon 10 for each sample from the sham group and the SNL group. (B) SNL significantly increased inclusion reads (X and Y) and decreased exclusion reads (Z) of Nrcam exon 10. N = 12 mice (3 biological repeats)/group. *P < 0.05, **P < 0.01 vs the sham group by paired t-test. (C) The Ψ value increased significantly in the SNL group. N = 12 mice (3 biological repeats)/group. **P < 0.01 vs the sham group by paired t-test.
