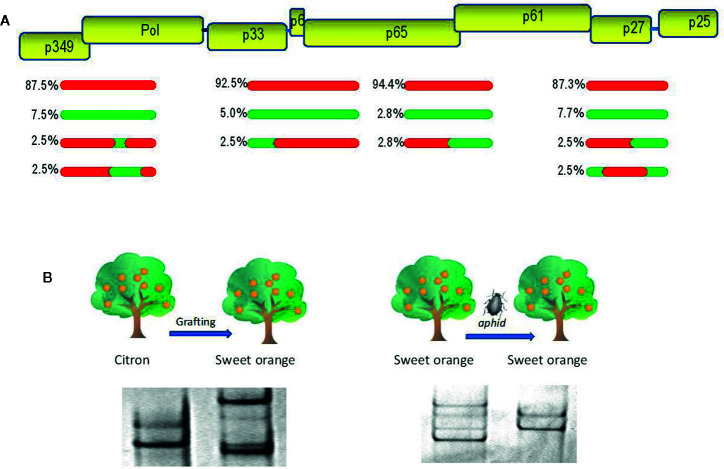
Figure 1.
Evolutionary analysis of citrus tristeza virus (CTV). (A) A population of recombinants within the CTV isolate SY568-B6 (Vives et al., 2005). Above is a partial representation of the genomic map of CTV with boxes corresponding to genes. Red and green lines indicate sequence types with about 90% nucleotide identity between them. The relative frequency of each sequence type is indicated. (B) Genetic variation of the CTV isolate T317 after host change (Rubio et al., 2000) and the CTV isolate 408F after a transmission event by the aphid Aphis gossypii (d’Urso et al., 2000). Genetic variants are showed as electrophoretic bands after single-strand conformation polymorphism (SSCP) analysis.

