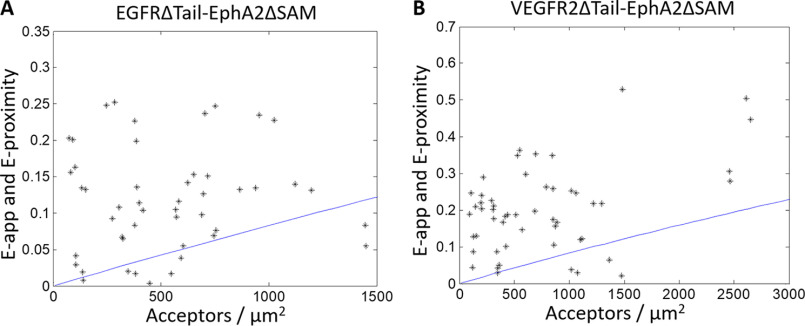
Figure 3.
Heterointeractions between truncated EGFR and EPHA2 (A) and truncated VEGFR2 and EPHA2 (B). In the case of EPHA2, the SAM domain was replaced with eYFP, and in the case of EGFR and VEGFR2, the post-kinase tail was replaced with MT. The cells were transfected with varying donor/acceptor ratios, with a total of 0.5–3 μg of EPHA2–eYFP DNA and either 1–5 μg of EGFR–MT DNA (A) or 3–8 μg of VEGFR2–MT DNA (B). Each black star represents the measurement for a 2–3-μm stretch of plasma membrane in a cell. Two regions were selected per cell, for a total of 56 and 50 data points in A and B, respectively. The solid blue line is the modeled monomer FRET proximity as a function of acceptor concentration (60, 61). In both cases, almost all data points lie above the monomer proximity line, demonstrating specific interactions.

