
Figure 4.
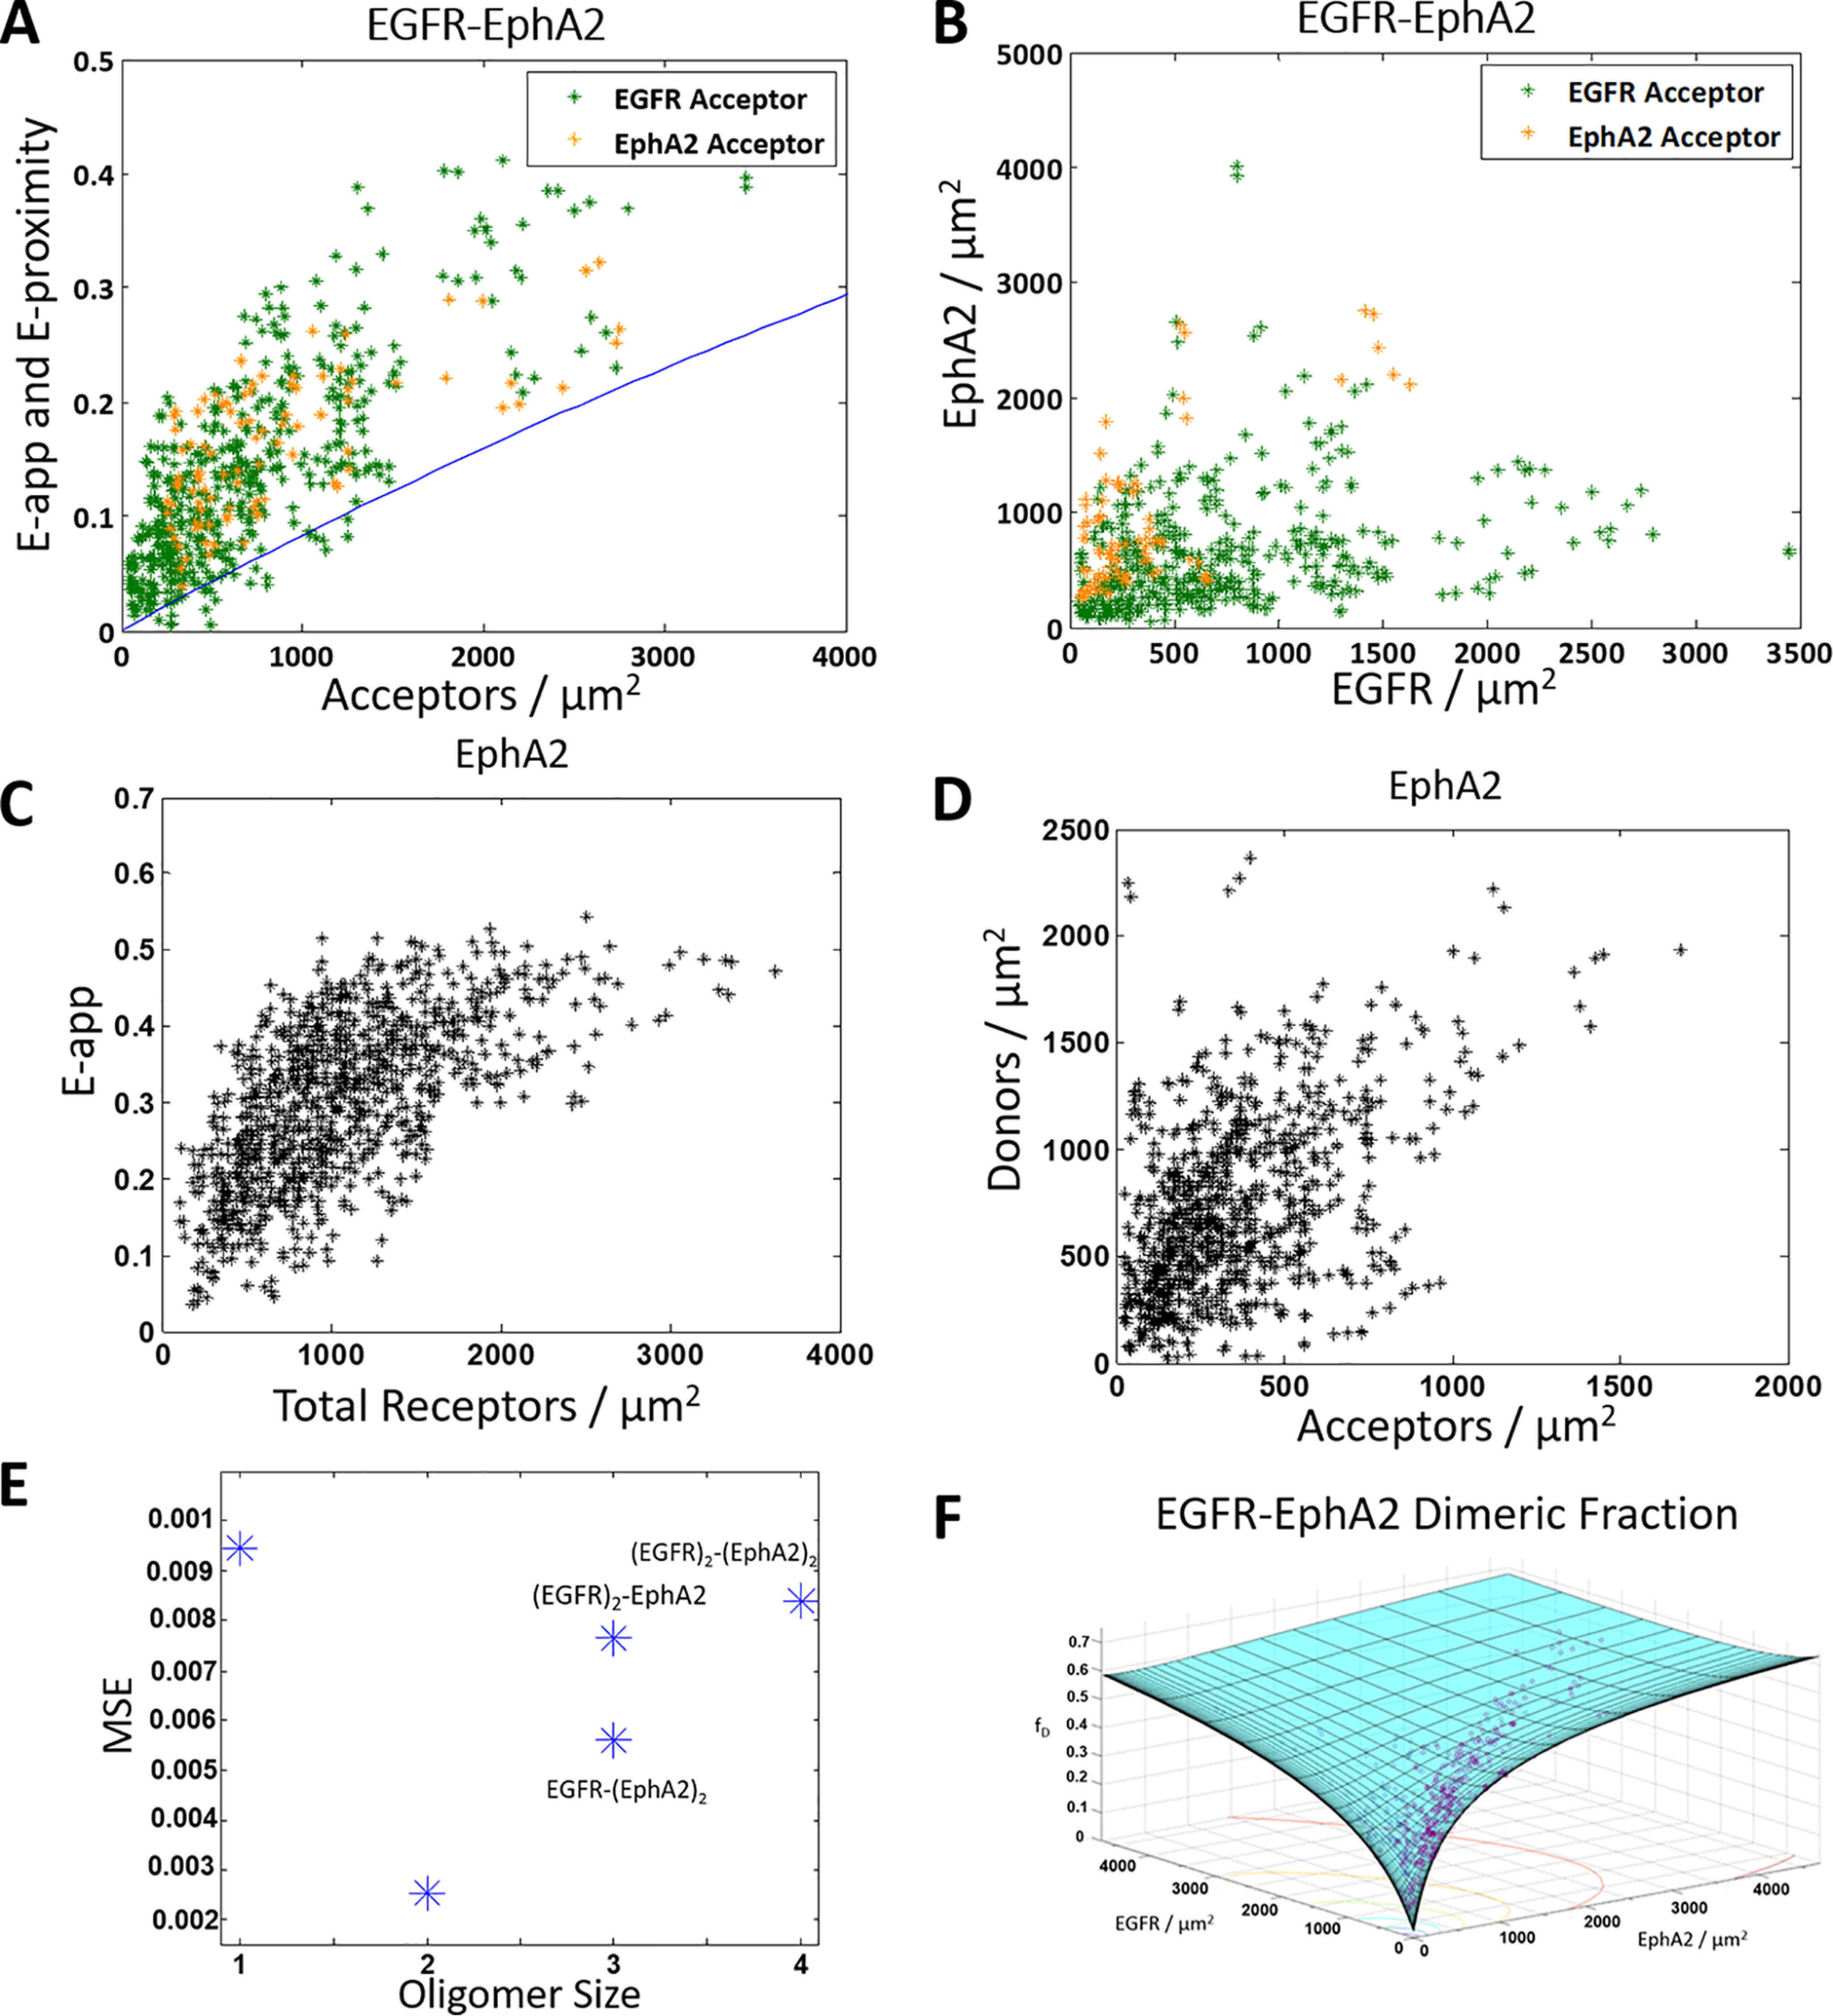
ECTM EGFR and ECTM EPHA2 form a heterodimer. A and B, HEK 293T cells were transiently co-transfected with versions of EGFR and EPHA2 where the IC domain has been replaced with a fluorophore: either MT as the donor or eYFP as the acceptor. Orange, ECTM EGFR–MT and ECTM EPHA2–eYFP. Green, ECTM EGFR–eYFP and ECTM EPHA2–MT. The cells were transfected with varying ratios of EGFR and EPHA2, with a total of 0.5–4 μg of EGFR DNA and 0.5–3 μg of EPHA2 DNA. A, apparent FRET versus acceptor concentration. Each data point represents the measurement for a 2–3 μm stretch of the plasma membrane of a cell. Two regions were selected per cell, for a total of 574 data points (480 with EGFR labeled with the acceptor and 94 with EPHA2 labeled with the acceptor). The solid blue line is the monomer FRET proximity as a function of acceptor concentration (60, 61). B, EGFR concentration versus EPHA2 concentration. C and D, HEK 293T cells were transiently co-transfected with ECTM EPHA2–MT and ECTM EPHA2–eYFP, with a 1:3 donor/acceptor ratio and a total of 0.5–3 μg of DNA. C, apparent FRET versus EPHA2 concentration (a total of 962 data points). D, donor concentration versus acceptor concentration. E, MSEs for the different interaction models in Fig. 1 (A–C). The heterodimer model yields the best fit. F, dimer fraction as a function of EGFR and EPHA2 concentrations. The purple symbols are the experimentally determined dimeric fractions, and the solid cyan surface is the best-fit surface for the heterodimer model.