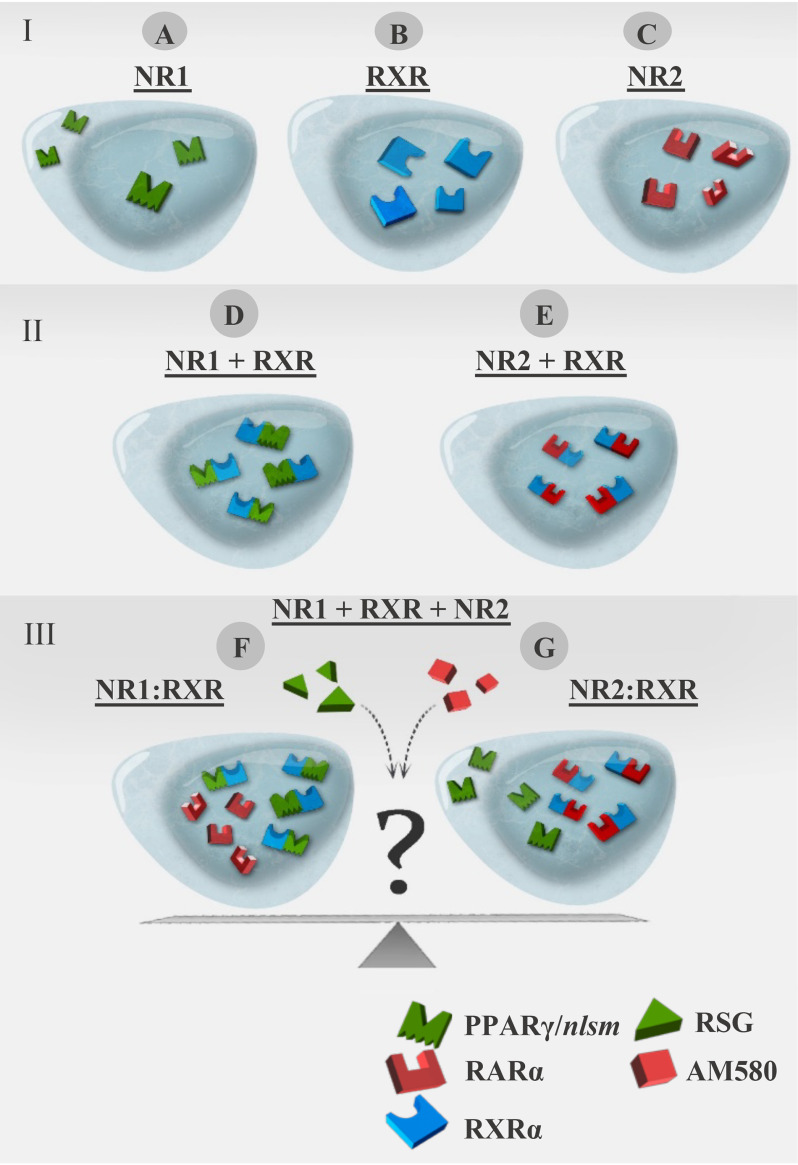
Figure 1.
Schematic representation of the translocation assay in a three-color imaging model system. I, single expression of NRs; distribution of NR1, RXRα, and NR2 expressed alone in WT HEK293 cells. A, PPARγ/nlsm (NLS mutant form) as an example of NR1 having a homogeneous, nucleocytoplasmic distribution. B, WT RXRα having nuclear localization. C, WT RARα as an example of NR2 having nuclear localization. II, double expression; NR1 or NR2 expressed in HEK293B-RXRα. D, nuclear redistribution of NR1 in HEK293B-RXRα. E, nuclear distribution of NR2 in HEK293B-RXRα. III, triple expression of NR1 + RXRα + NR2 to detect the competition between NR1 and NR2 for heterodimerization with RXRα, in the absence or presence of specific ligands of NR1 and/or NR2. F, NR1 is expected to translocate to the nucleus if NR1 rather than NR2 is the preferred heterodimerization partner of RXRα. G, NR1 is expected to be redistributed homogeneously if NR2 is the preferred heterodimerization partner of RXRα rather than NR1.

