Figure 8.

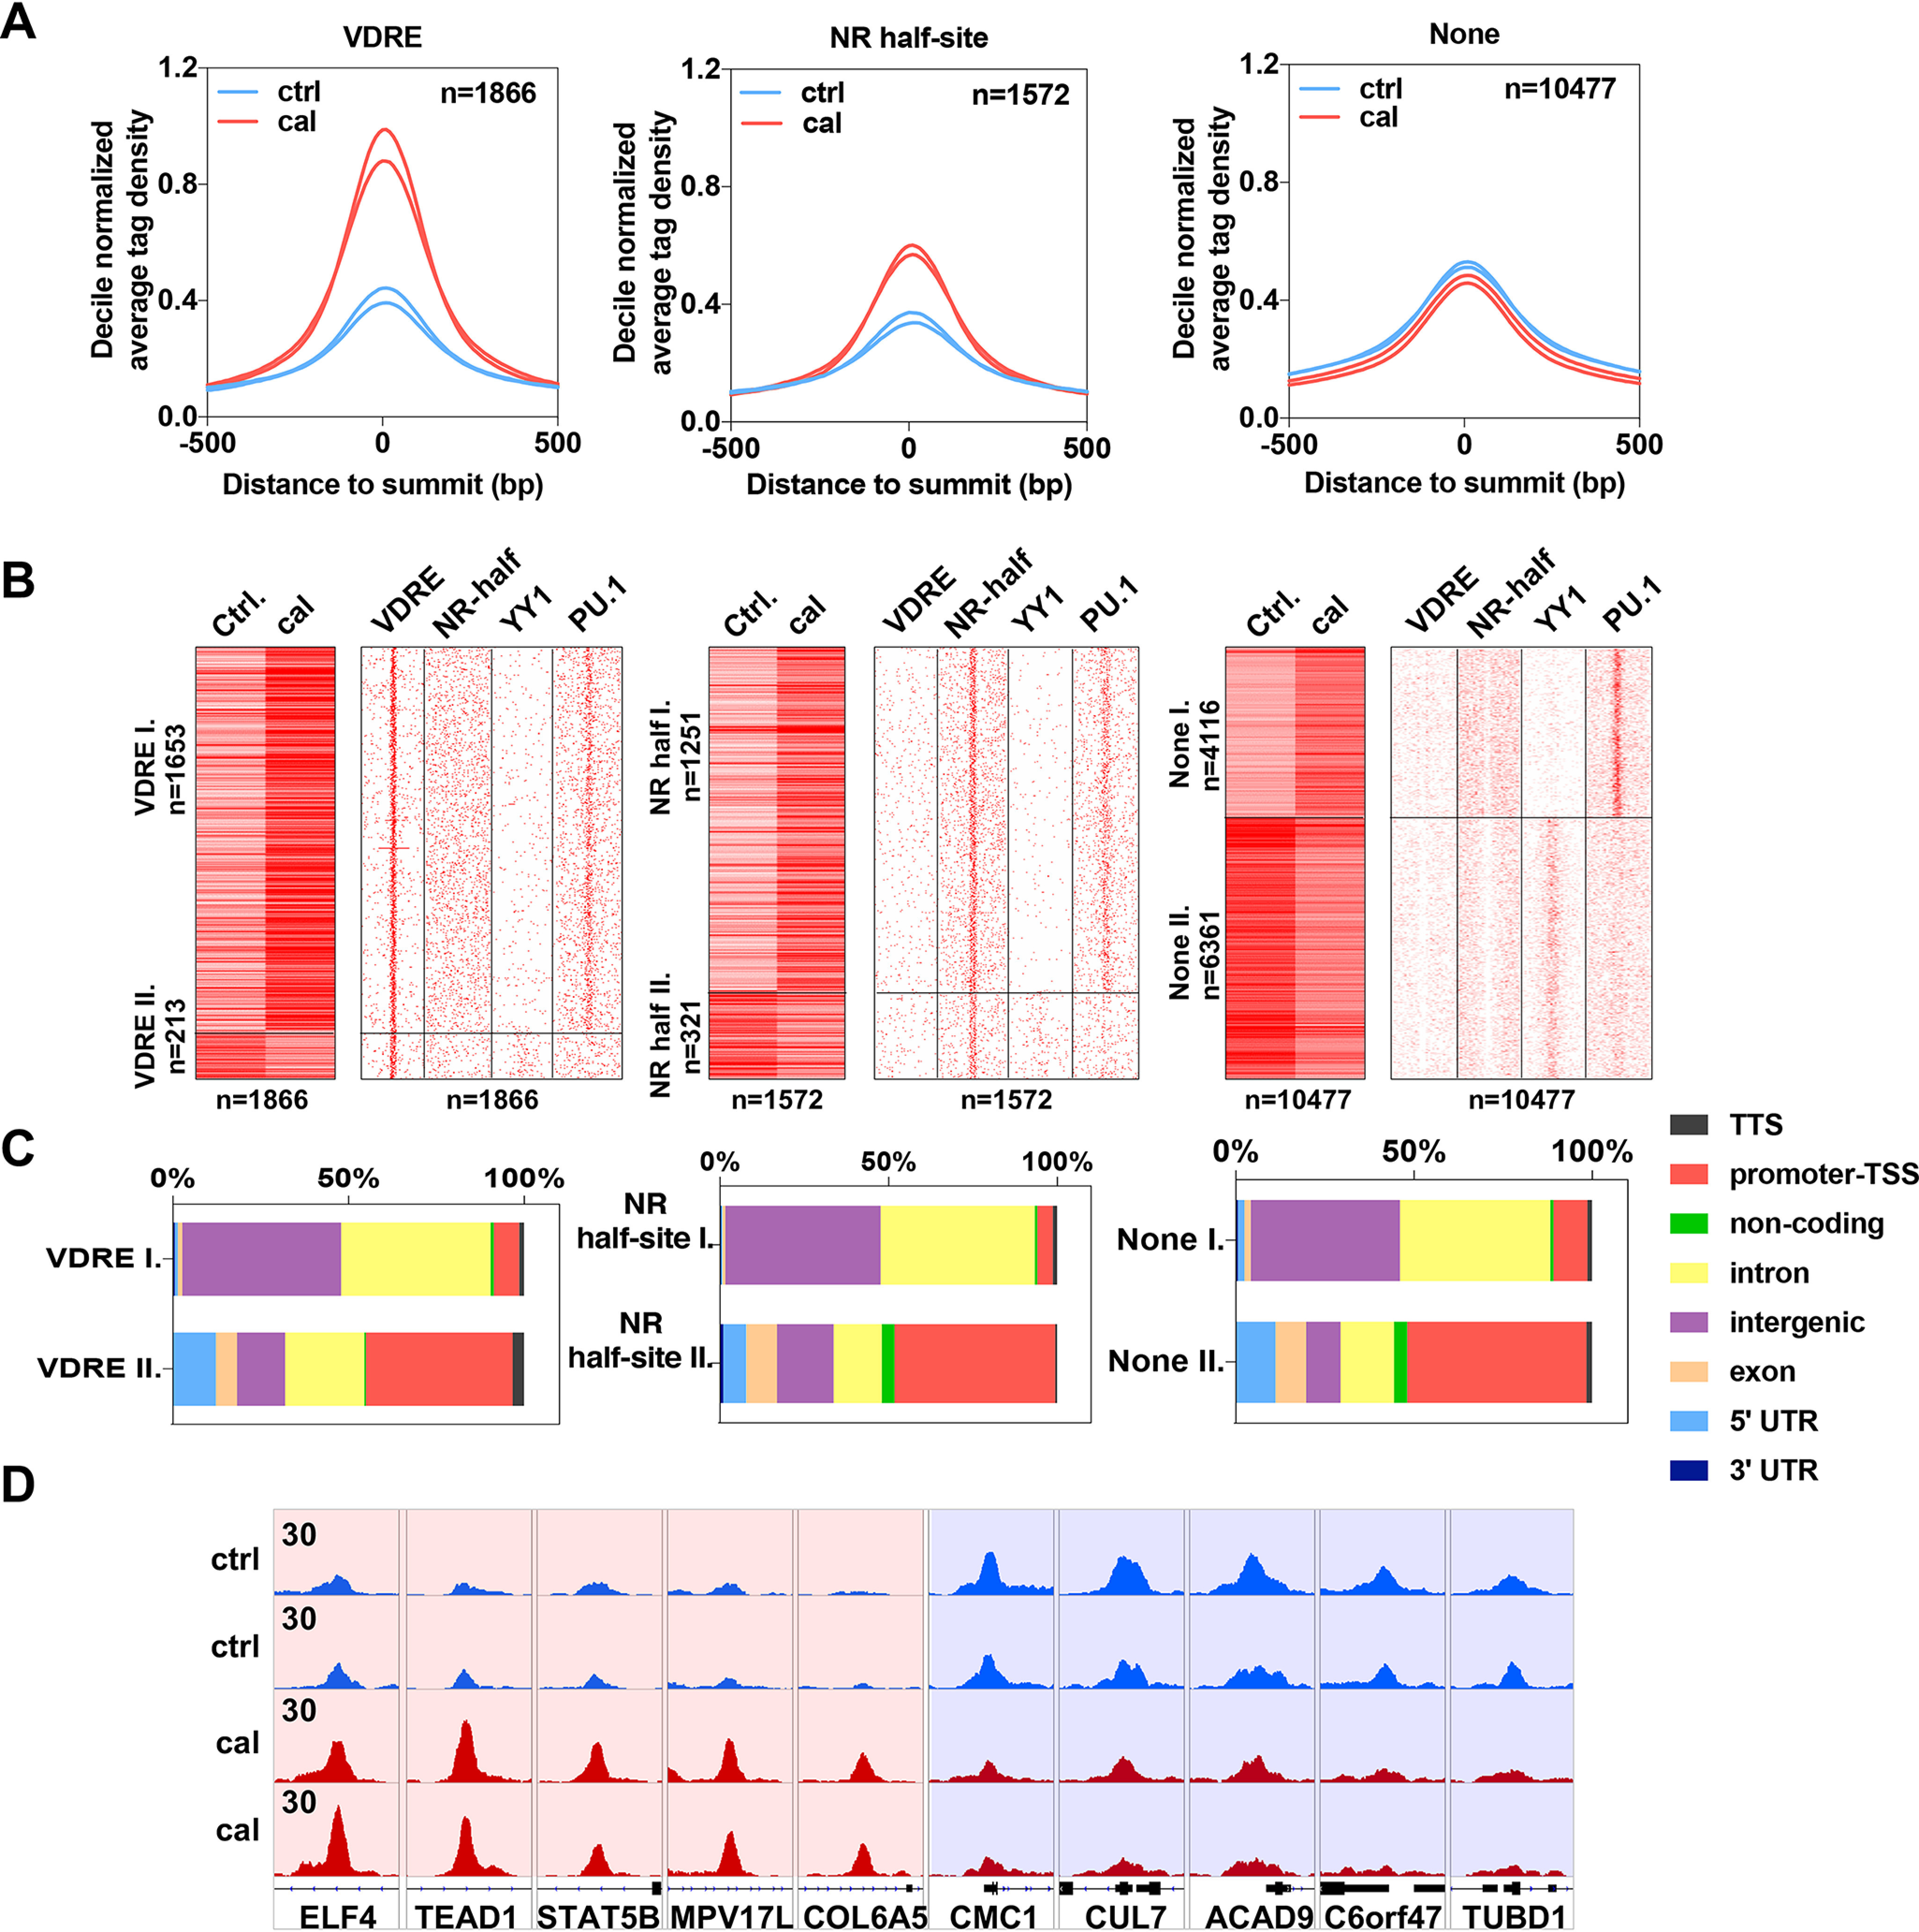
Chromatin binding of VDR is dynamically regulated by calcitriol. A, histograms showing the decile-normalized average tag density of the VDR binding sites that contain VDRE (n = 1866), NR half-site (n = 1572), or None (n = 10477) in the presence of cal or vehicle (Ctrl). B, left, heat maps representing the tag densities of VDR binding sites with VDRE, NR half-site, or None upon control (Ctrl) and calcitriol treatment. Regions were divided by k-means clustering (k = 2). Right, motif distribution heat maps showing the presence of VDRE, NR half-site, YY1, and PU.1 motifs in 2-kb frames around the VDR binding sites. C, bar charts showing the genomic distribution of VDR binding sites separately for the two clusters (I and II) of regions that contain VDRE, NR half-site, or None. D, an Integrative Genomics Viewer (IGV) snapshot of VDR coverage representing ten VDR binding sites upon control (Ctrl) or cal treatment from clusters I (left) and II (right). The interval scale is 30 in all cases.
