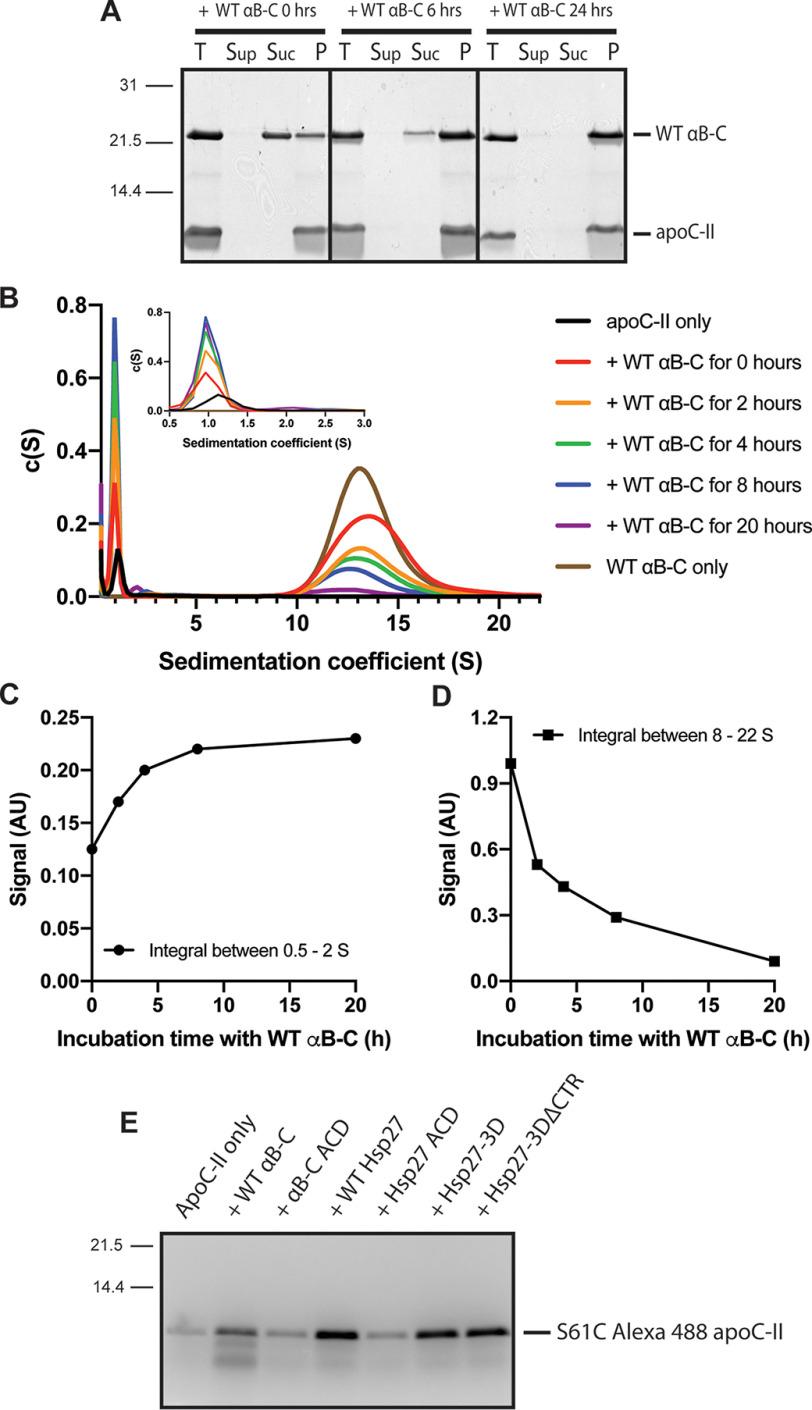
Figure 5.
Analysis of the time course of apoC-II fibril dissociation by WT αB-C. ApoC-II fibrils (56 μm) were formed for 72 h at 30 °C. A, fibrils were incubated with WT αB-C (12.8 μm) for 0–24 h. Each sample was centrifuged as described above. The supernatant (Sup), sucrose (Suc), and pellet (P) layers were collected and analyzed by SDS-PAGE alongside the total (T) uncentrifuged samples. B, SV-AUC analysis of preformed apoC-II fibrils (56 μm) incubated with WT αB-C (12.8 μm) for 0 (red), 2 (orange), 4 (green), 8 (blue), or 20 (purple) h prior to SV-AUC. ApoC-II fibrils (black) and WT αB-C (brown) incubated alone for 20 h are also shown. C and D, plots of the integral of the peak between 0.5 and 2 S (C) and between 8 and 22 S (D) in the c(s) distribution shown in B as a function of incubation time with WT αB-C. E, apoC-II fibrils (56 μm) formed with 10% S61C Alexa 488–labeled apoC-II were incubated with the indicated sHSP construct (12.8 μm) for 24 h and centrifuged as described above. The supernatant fractions were analyzed by SDS-PAGE and imaged using a filter set for Alexa 488 as described under “Experimental procedures.”

