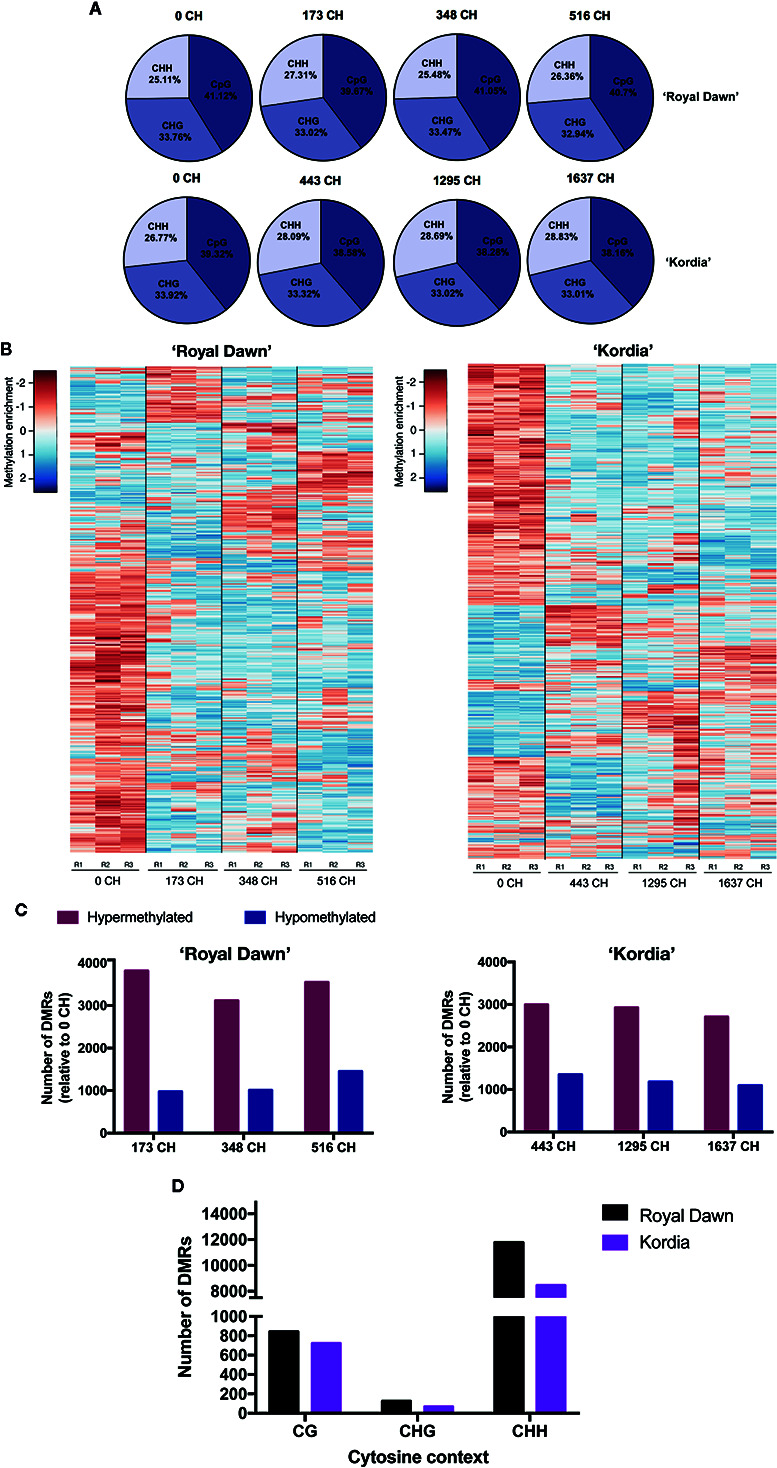
Figure 2.

Methylation changes across chilling accumulation in floral buds of ‘Royal Dawn’ and ‘Kordia’. (A) Relative levels of methylated cytosines in the contexts CG, CHG and CHH. (B) Heatmap of DNA methylation levels for 1,000 DMRs (log2FC >3; FDR <0.01; all cytosine contexts) identified from comparisons of 100-bp windows among 0, 173, 348 and 516 CH in ‘Royal Dawn’; and comparisons among 0, 443, 1,295 and 1,637 CH in ‘Kordia’. (C) Number of hypermethylated and hypomethylated regions from 173 vs 0 CH (hyper = 3,814; hypo = 975), 348 vs 0 CH (hyper = 3,115; hypo = 1,010), and 516 vs 0 CH (hyper = 3,546; hypo =1,451) in ‘Royal Dawn’; and number of regions at 443 vs 0 CH (hyper = 2,990; hypo = 1,352), 1,295 vs 0 CH (hyper = 2,919; hypo = 1,179) and 1,637 vs 0 CH (hyper = 2,703; hypo = 1,094) in ‘Kordia’. (D) Number of DMRs in each cytosine context from comparisons between 173, 348 and 516 CH against 0 CH in ‘Royal Dawn’ (CG, n = 843; CHG, n = 126; CHH, n = 11,786); and comparisons between 443, 1,295 and 1,637 CH against 0 CH in ‘Kordia’ (CG, n = 723; CHG, n = 67; CHH, n = 8,448). H = C, T or A.
