Figure 3.
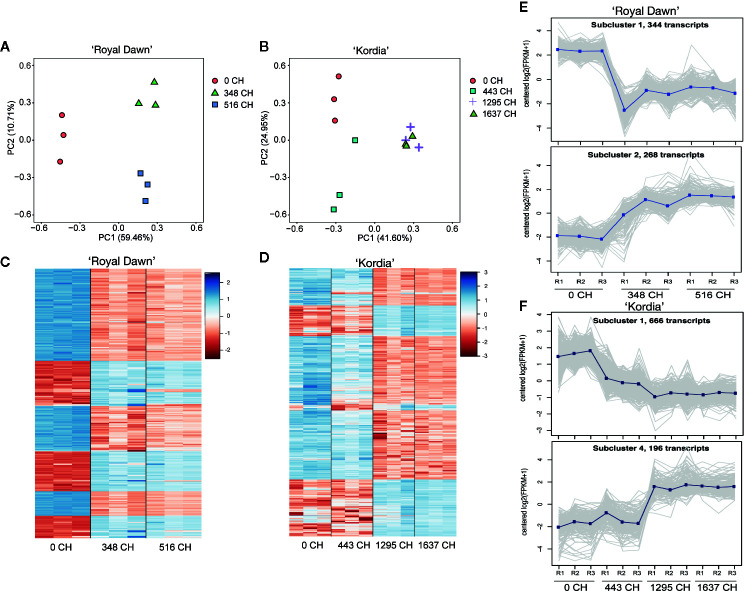
Transcriptome profile during chilling accumulation in ‘Royal Dawn’ and ‘Kordia’. (A) Principal component analysis of global gene expression with three biological replicates at 0, 348 and 516 CH in ‘Royal Dawn’; and (B) at 0, 443, 1,295 and 1,637 CH for ‘Kordia’. (C) Heatmap representing the 1,000 transcripts with most variance among the conditions in ‘Royal Dawn’ and (D) ‘Kordia’. Color key indicates the median of log2 TMM-normalized values and red to blue represents low to high levels of transcript, respectively. (E) Representative subcluster plots (2 out of 10) of the overall genes that increase or decrease their expression during chilling accumulation in ‘Royal Dawn’ and (F) subcluster plots (2 out of 11) of ‘Kordia’.

