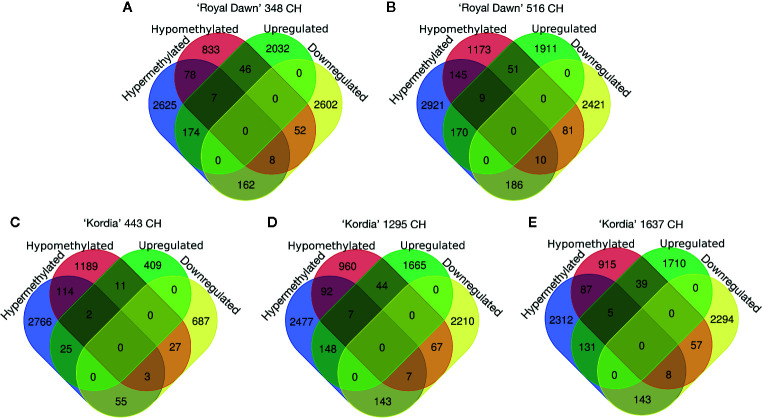
Figure 4.
Venn diagrams representing the number of DEGs (upregulated and downregulated genes) that overlapped with DMRs (hypermethylations and hypomethylations). (A) Overlapping of DMRs and DEGs at 348 CH and (B) 516 CH for ‘Royal Dawn’. (C) Number of DMRs and DEGs that overlapped at 443 CH, (D) 1,295 CH and (E) 1,637 CH for ‘Kordia’.

