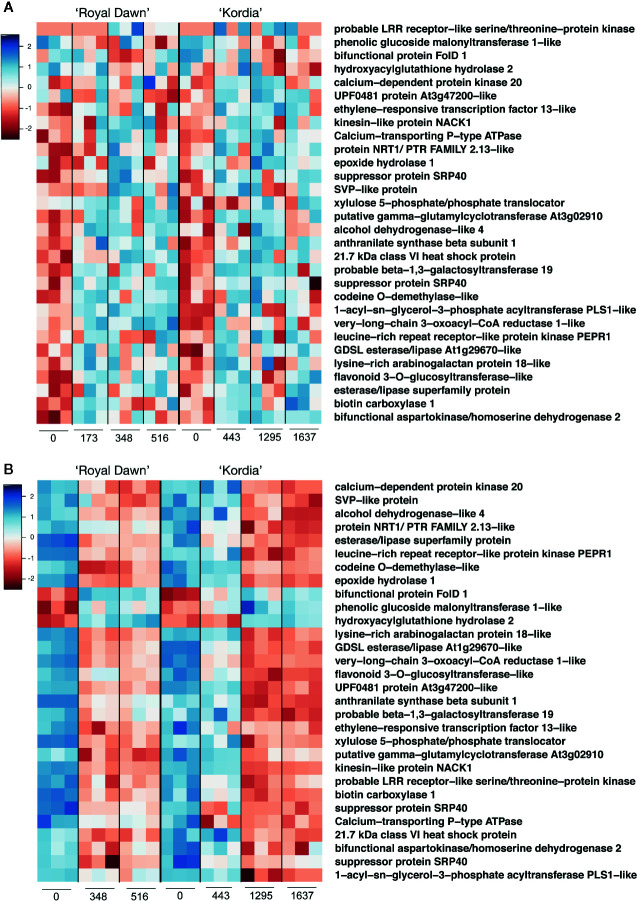
Figure 5.
Representation of thirty genes that showed a conserved hyper/hypomethylation pattern that overlapped with down/upregulated genes. (A) Methylation levels (log2 enrichment) from DMRs related to hyper and hypomethylations at different CH accumulation points for ‘Royal Dawn’ and ‘Kordia’. (B) Transcript levels (log2 TMM-normalized values) from DEGs related to downregulated and upregulated genes during CH accumulation in ‘Royal Dawn’ and ‘Kordia’. Color key from red to blue represents low to high levels, respectively.

