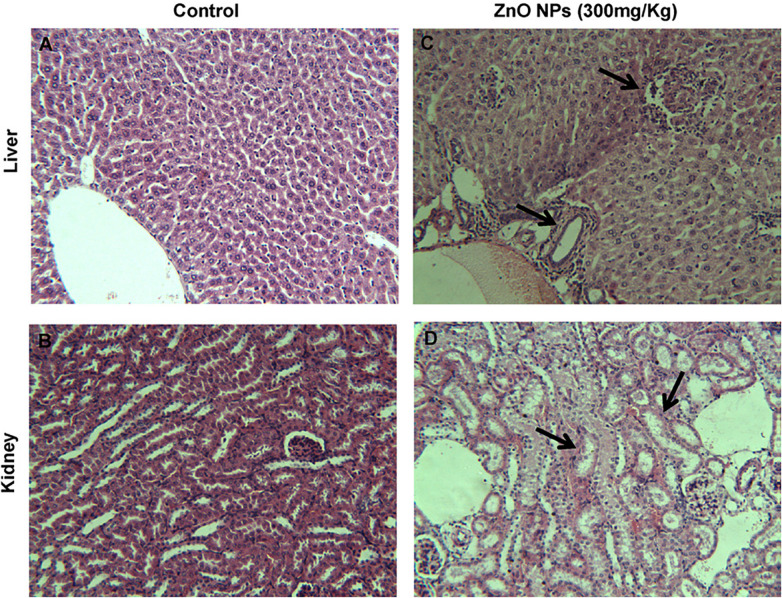
FIGURE 11.
Histopathology of liver and kidney tissues in mice, ZnO NPs treated for 14 consecutive days. (A,B) Control group showing normal liver and kidney, (C,D) pathological alterations in the liver and kidney of ZnO NPs (300 mg/kg) treated group (indicated by arrow); magnification (200×). Adapted from Sharma et al. (2012) with permission.

