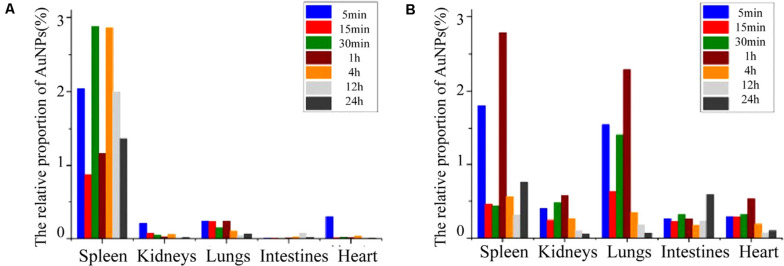
FIGURE 8.
The relative distribution proportion of Au NPs in the spleen, kidneys, lungs, intestines, and heart of SD rats at 5, 15, 30 min, 1, 4, 12, and 24 h after IVI (A), and after ISI in the tarsal tunnel (B). Adapted from Shi et al. (2016) and Jia et al. (2017) with permission.

