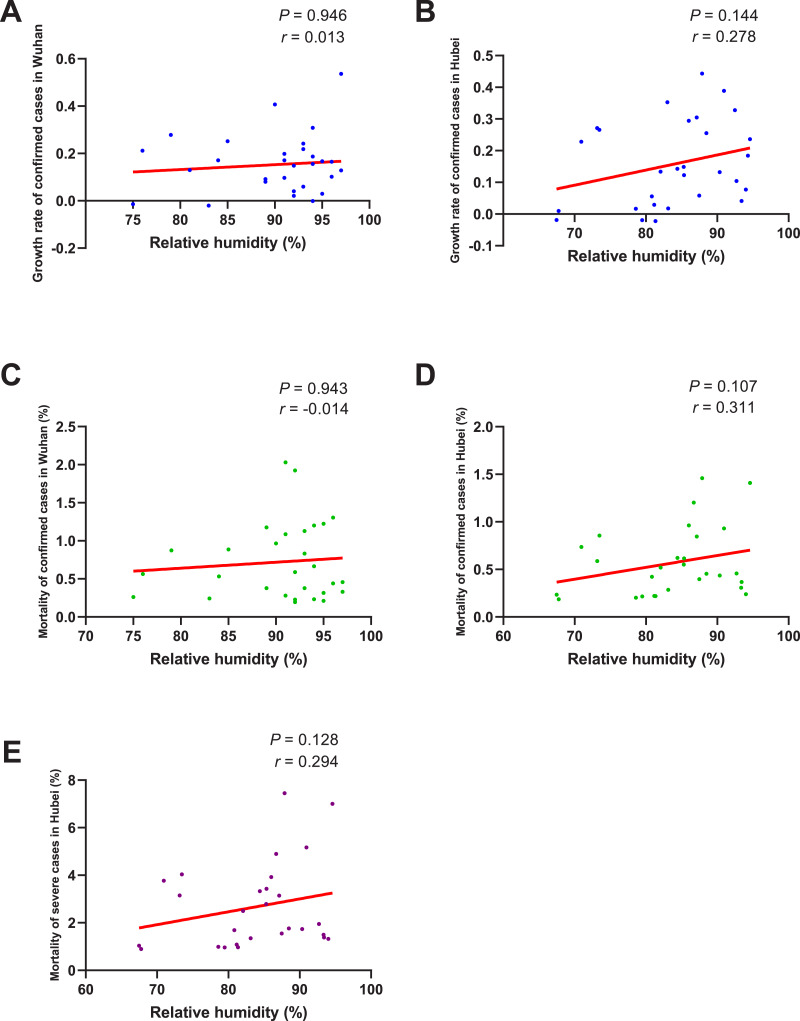
Figure 5. Correlation between relative humidity and growth rate/mortality of COVID-19 cases.
When the data of the air temperature and the corresponding outcome were both normally distributed, Pearson’s analysis was performed to investigate their correlation; otherwise, Spearman’s analysis was performed instead. The correlation coefficient r measures the strength and direction of the linear relationship between the two variables. Positive r or negative r represents positive correlation or negative correlation, respectively, and the closer r is to +1 or −1, the more closely the two variables are related. P-value was used to test the significance of the correlation, and P < 0.05 was considered statistically significant. (A) Correlation between relative humidity and the growth rate of confirmed cases in Wuhan. (B) Correlation between relative humidity and the growth rate of confirmed cases in Hubei. (C) Correlation between relative humidity and the mortality of confirmed cases in Wuhan. (D) Correlation between relative humidity and the mortality of confirmed cases in Hubei. (E) Correlation between relative humidity and the mortality of severe cases in Hubei.

