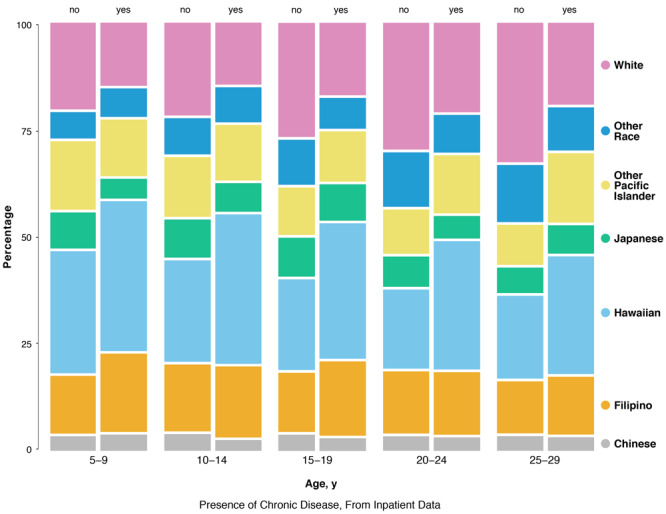
Figure 1.
Three-way mosaic plot of chronic disease status of patients, by race/ethnicity and age, inpatient data for children and young adults aged 5–29 years from the Hawai‘i Health Information Corporation, January 2015 through December 2016 (N = 9,467 unique individuals).
| Race/Ethnicity | Age, y |
|||||||||
|---|---|---|---|---|---|---|---|---|---|---|
| 5–9 |
10–14 |
15–19 |
20–24 |
25–29 |
||||||
| No | Yes | No | Yes | No | Yes | No | Yes | No | Yes | |
| White | 21.3 | 15.5 | 22.8 | 15.2 | 28.1 | 17.8 | 31.2 | 22.0 | 34.3 | 20.1 |
| Other race | 6.4 | 6.9 | 8.9 | 8.5 | 11.0 | 7.5 | 13.4 | 9.2 | 14.0 | 10.5 |
| Other Pacific Islander | 16.8 | 13.9 | 14.6 | 13.6 | 11.6 | 12.3 | 10.9 | 14.2 | 9.8 | 17.0 |
| Japanese | 8.8 | 4.8 | 9.3 | 7.0 | 9.5 | 8.9 | 7.4 | 5.5 | 6.2 | 6.9 |
| Hawaiian | 30.0 | 36.8 | 24.9 | 36.7 | 22.3 | 33.3 | 19.4 | 31.5 | 20.3 | 28.9 |
| Filipino | 14.1 | 19.2 | 16.4 | 17.4 | 14.5 | 18.2 | 15.2 | 15.3 | 12.8 | 14.2 |
| Chinese | 2.5 | 2.9 | 3.1 | 1.6 | 3.0 | 2.1 | 2.6 | 2.3 | 2.6 | 2.3 |

