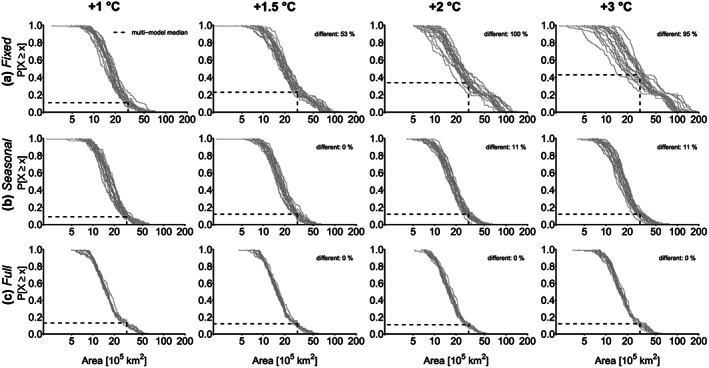
Figure 3.

Probability of exceedance ( ) for the mean heatwave area of the largest 100 heatwaves for individual model simulations (gray lines) for (a) fixed thresholds, (b) seasonally moving thresholds, and (c) fully moving thresholds for +1, +1.5, +2, and +3 °C global warming compared to 1871–1890. The % different indicates the relative number of models whose distributions show a significant difference (Kolmogorov‐Smirnov test, α=0.05) to the distributions for +1 °C warming. The dashed lines show multimodel median exceedance probabilities for an area of 3 million km2.
