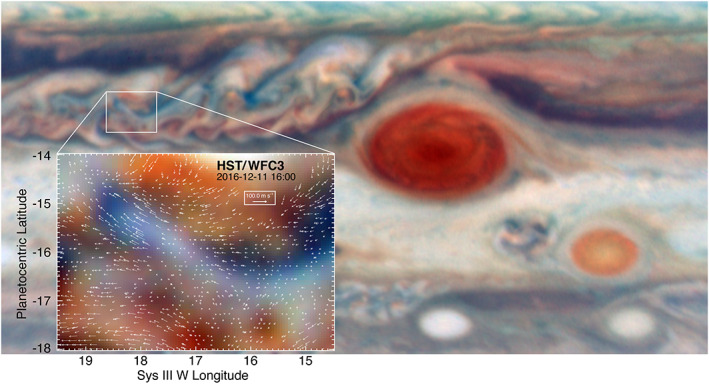
Figure 6.

Contextual HST WFC3 image for Figure 5d, showing its position with respect to the GRS. The inset shows the wind field derived from tracking cloud features over a 45‐min interval, as a residual after subtracting the mean zonal wind profile. The winds appear to be a maximum at the western (left) end of the blue lobate feature, with a marked drop in velocities, that is, a region of wind shear, at the edges of the feature. This image was taken within a few minutes of the time at which the JunoCam image in Figure 5d was observed.
