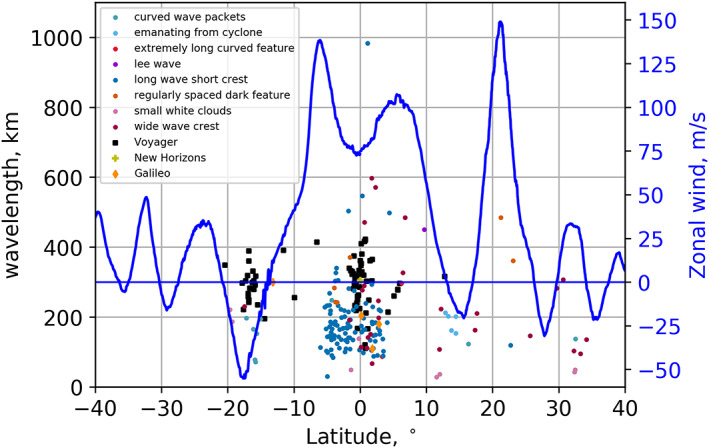
Figure 17.

Wavelengths of waves and wave‐like features detected in PJ1 and PJ3‐PJ20 by JunoCam. Measurements of different types of wave morphologies are color‐coded as in Figure 15. Mean zonal wind velocities for 2017–2018 (Wong et al., 2020) are plotted in blue. Values for Voyager, New Horizons, and Galileo are taken from their respective references in Table 1. Wavelengths for wave packets detected by HST and ground‐based images (Fletcher et al., 2018; Simon et al., 2018) are greater than 1,100 km and clustered around 14.5°N (see Table 1).
