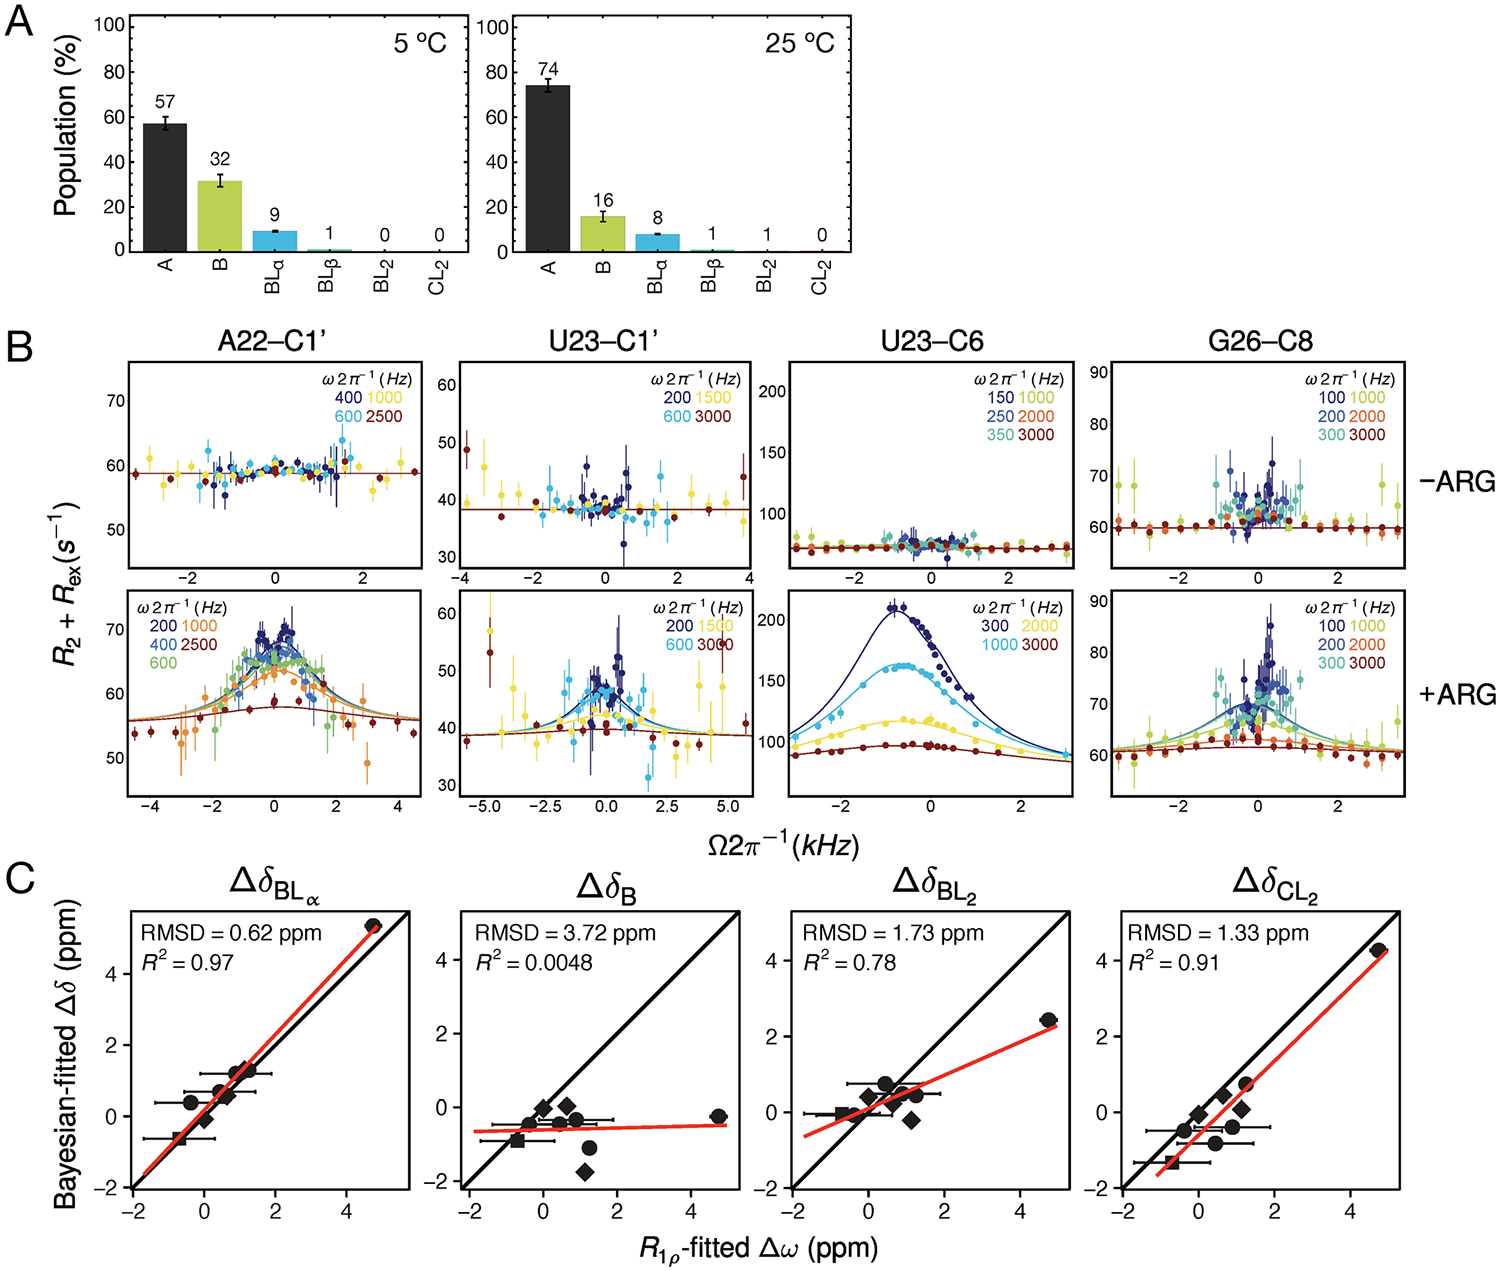
Figure 6.

Testing the model by NMR RD. (A) The predicted distribution of RNA states at the conditions under which the RD measurements were run (0.2 mM ARG, 1.5 mM RNA) at 5 and 25 °C. (B) Off-resonance RD data for the resonances with detectable chemical exchange at 5 °C. Lines represent global fit to BM equations. (C) Comparison of fitted chemical shifts obtained by RD with the chemical shifts obtained by Bayesian fitting to CSP data. Closest agreement is with chemical shifts for state BLα, consistent with RD reporting on the binding to the α site in the B conformation.
