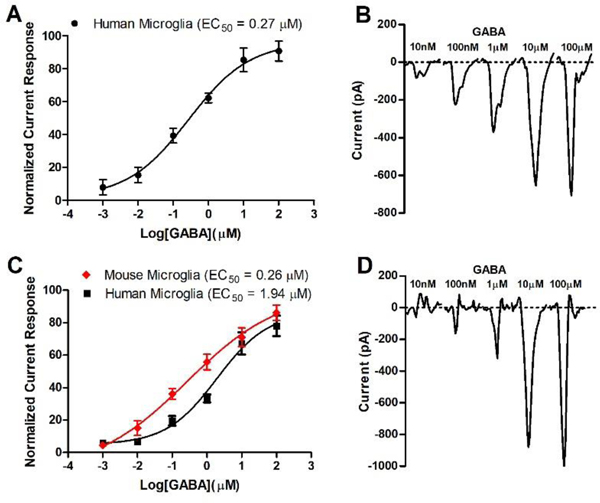
Figure 1.
Electrophysiology measurement (patch clamp). A) Current response with HMC3 human microglia cells. Data (n = 12) were normalized in response to maximum current measured with 1 mM GABA and depicted as mean and SEM. EC50 was calculated by non-linear regression; B) 10 second average current sweeps of increasing concentrations of GABA with HMC3 cells; C) Current response with immortalized human and mouse microglia cells.24 Data (n = 16) were normalized in response to maximum current measured with 1 mM GABA and depicted as mean and SEM. D) 10 second average current sweeps of increasing concentrations of GABA with immortalized human microglia cells. EC50 values were calculated by non-linear regression.

