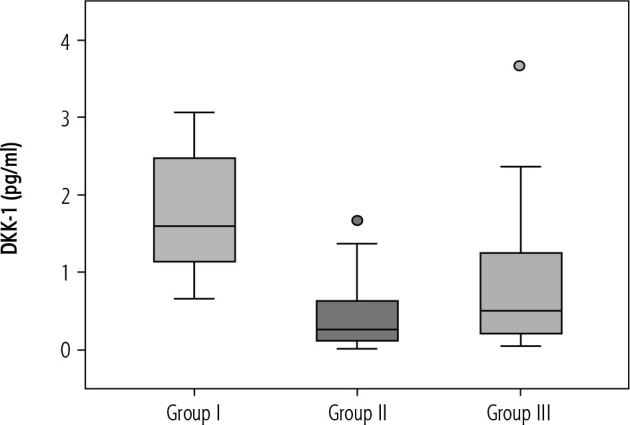
Fig. 1.

Box plot presentation of Dickkopf-1 (DKK-1) (pg/ml) in the studied groups. The box plot represents the interquartile range from 25th to the 75th percentiles. The whiskers below and above the box represents 10-90 percentiles. The line across each box represents the median value
