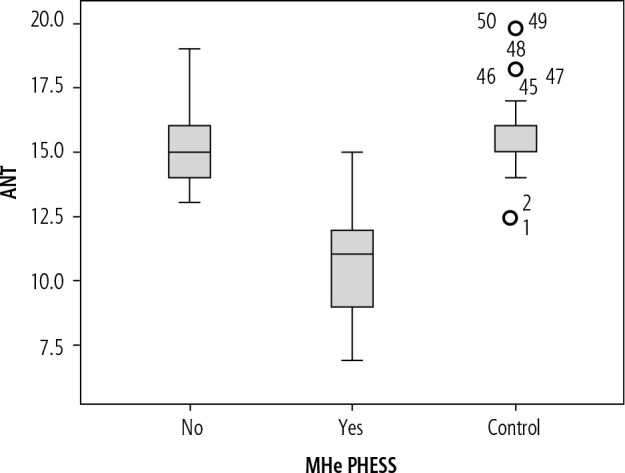
Fig. 2.

ANT in controls, cirrhotics with MHE and without MHE. ANT was lower in MHE (10.81; 95% CI: 10.48-11.13) in comparison with non-MHE (15.27; 95% CI: 15.02-15.51, p < 0.01) patients having cirrhosis or controls (15.78; 95% CI: 15.50-16.05, p = 0.002)
