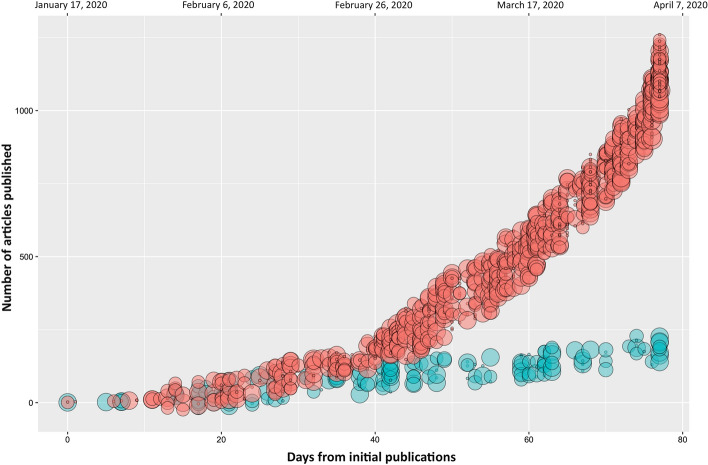
Fig. 3.
Relationship between days from the start of the pandemics, number of articles published and type of articles during COVID-19 pandemic (red circles) and 2009 H1N1 swine flu pandemic (green circles). On the x axis the days from the start of COVID-19 pandemic (top axis) and the days from the first publication for each pandemic (bottom axis) are reported. On the y axis the total number of articles published for each pandemic is reported. Circle size has been arbitrarily classified in order to show different levels of clinical evidence: at increasing circle size, increase the value of the article (circle size: 1: secondary articles and human non-medical research; 7: in silico research; 8: in vitro research; 9: animal research; 11: case reports; 14: observational studies and case series; 17: randomized controlled trials; 20: systematic reviews). The values were jittered over the y axis to reduce superimposition of data

