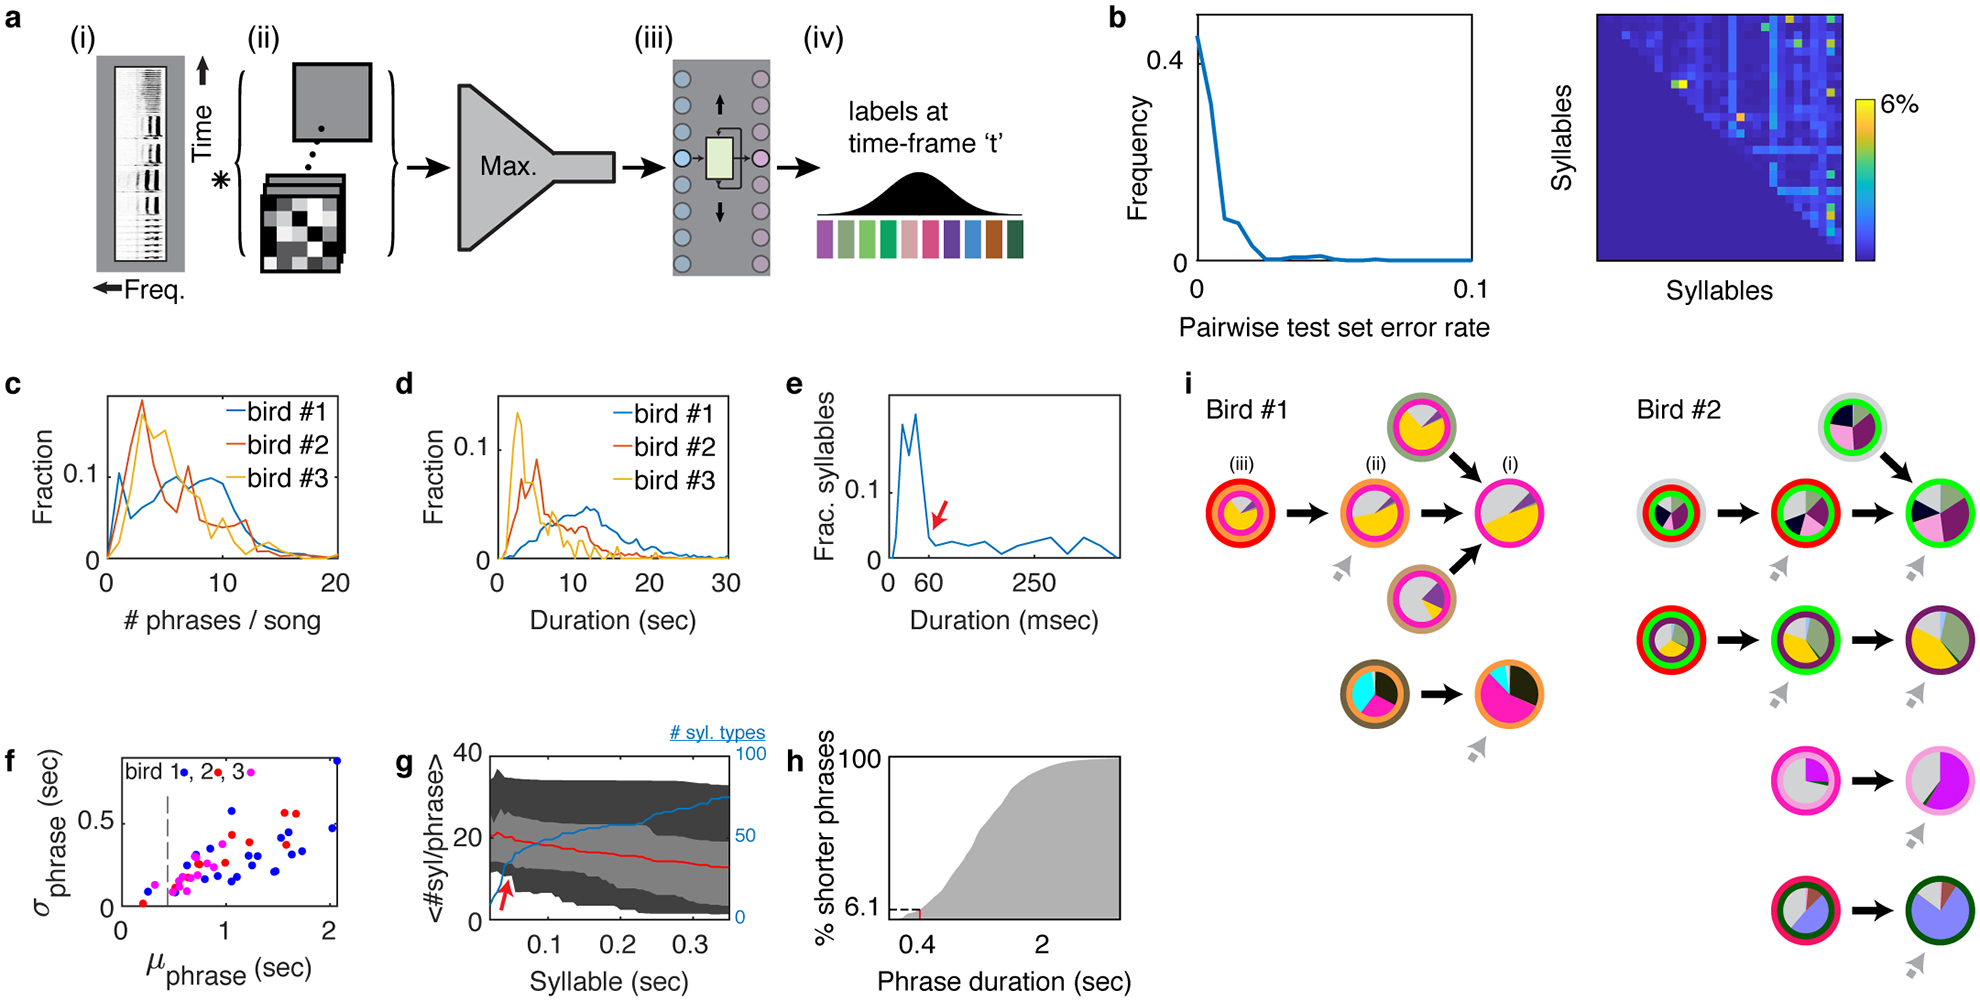
Extended Data Fig. 1 |. Canary song annotation and sequence statistics.

a. Architecture of syllable segmentation and annotation machine learning algorithm. (i) A spectrogram is fed to the algorithm as a 2D matrix in segments of 1 second. (ii). Convolutional and max-pooling layers learn local spectral and temporal filters. (iii). Bidirectional recurrent Long-Short-Term-Memory (LSTM) layer learns temporal sequencing features. (iv). Projection onto syllable classes assigns a probability for each 2.7 millisecond time bin and syllable. b. After manual proof reading (methods), a support vector machine (SVM) classifier was used to assess the pairwise confusion between all syllables classes of bird #1 (methods). The test set confusion matrix (right) and its histogram (left) show that in rare cases the error exceeded 1% and at most reached 6%. Since the higher values occurred only in phrases with 10s of syllables this metric guarantees that most of the syllables in every phrase cannot be confused as belonging to another syllable class. Accordingly, the possibility for making a mistake in identifying a phrase type is negligible. c. Histogram of the number of phrases per song for 3 birds used in this study. d. Histogram of song durations for 3 birds. e. Histogram of mean syllable durations, 85 syllable classes from 3 birds. Red arrow marks the duration, below which all trill types have more than 10 repetitions on average. f. Relation between phrase classes’ duration mean (x-axis) and standard deviation (y-axis). Syllables classes (dots) of 3 birds are colored by the bird number. Dashed line marks 450 msec, an upper limit for the decay time constant of GCaMP6f. g. Range of mean number of syllables per phrase (y-axis) for all syllable types with mean duration shorter than the x-axis value. Red line is the median, light gray marks the 25%, 75% quantiles and dark gray mark the 5%, 95% quantile (blue line marks the # of syllable types contributing to these statistics). The red arrow matches the arrow in panel e. h. Cumulative histogram of trill phrase durations. i. All complex phrase transitions with ≥2nd order dependence on song history context (for birds #1, #2). For each phrase type that precedes a complex transition, the context dependence is visualized by a graph called a Probabilistic Suffix Tree (methods). Transition outcome probabilities are marked by pies at the center of each node. The song context—phrase sequence—that leads to the transition, is marked by concentric circles, the inner most being the phrase type preceding the transition. Nodes are connected to indicate the sequences in which they are added in the search for longer Markov chains that describe context dependence (e.g. i-iii for 1st to 3rd order Markov chains). Grey arrows indicate additional incoming links that are not shown for simplicity.
