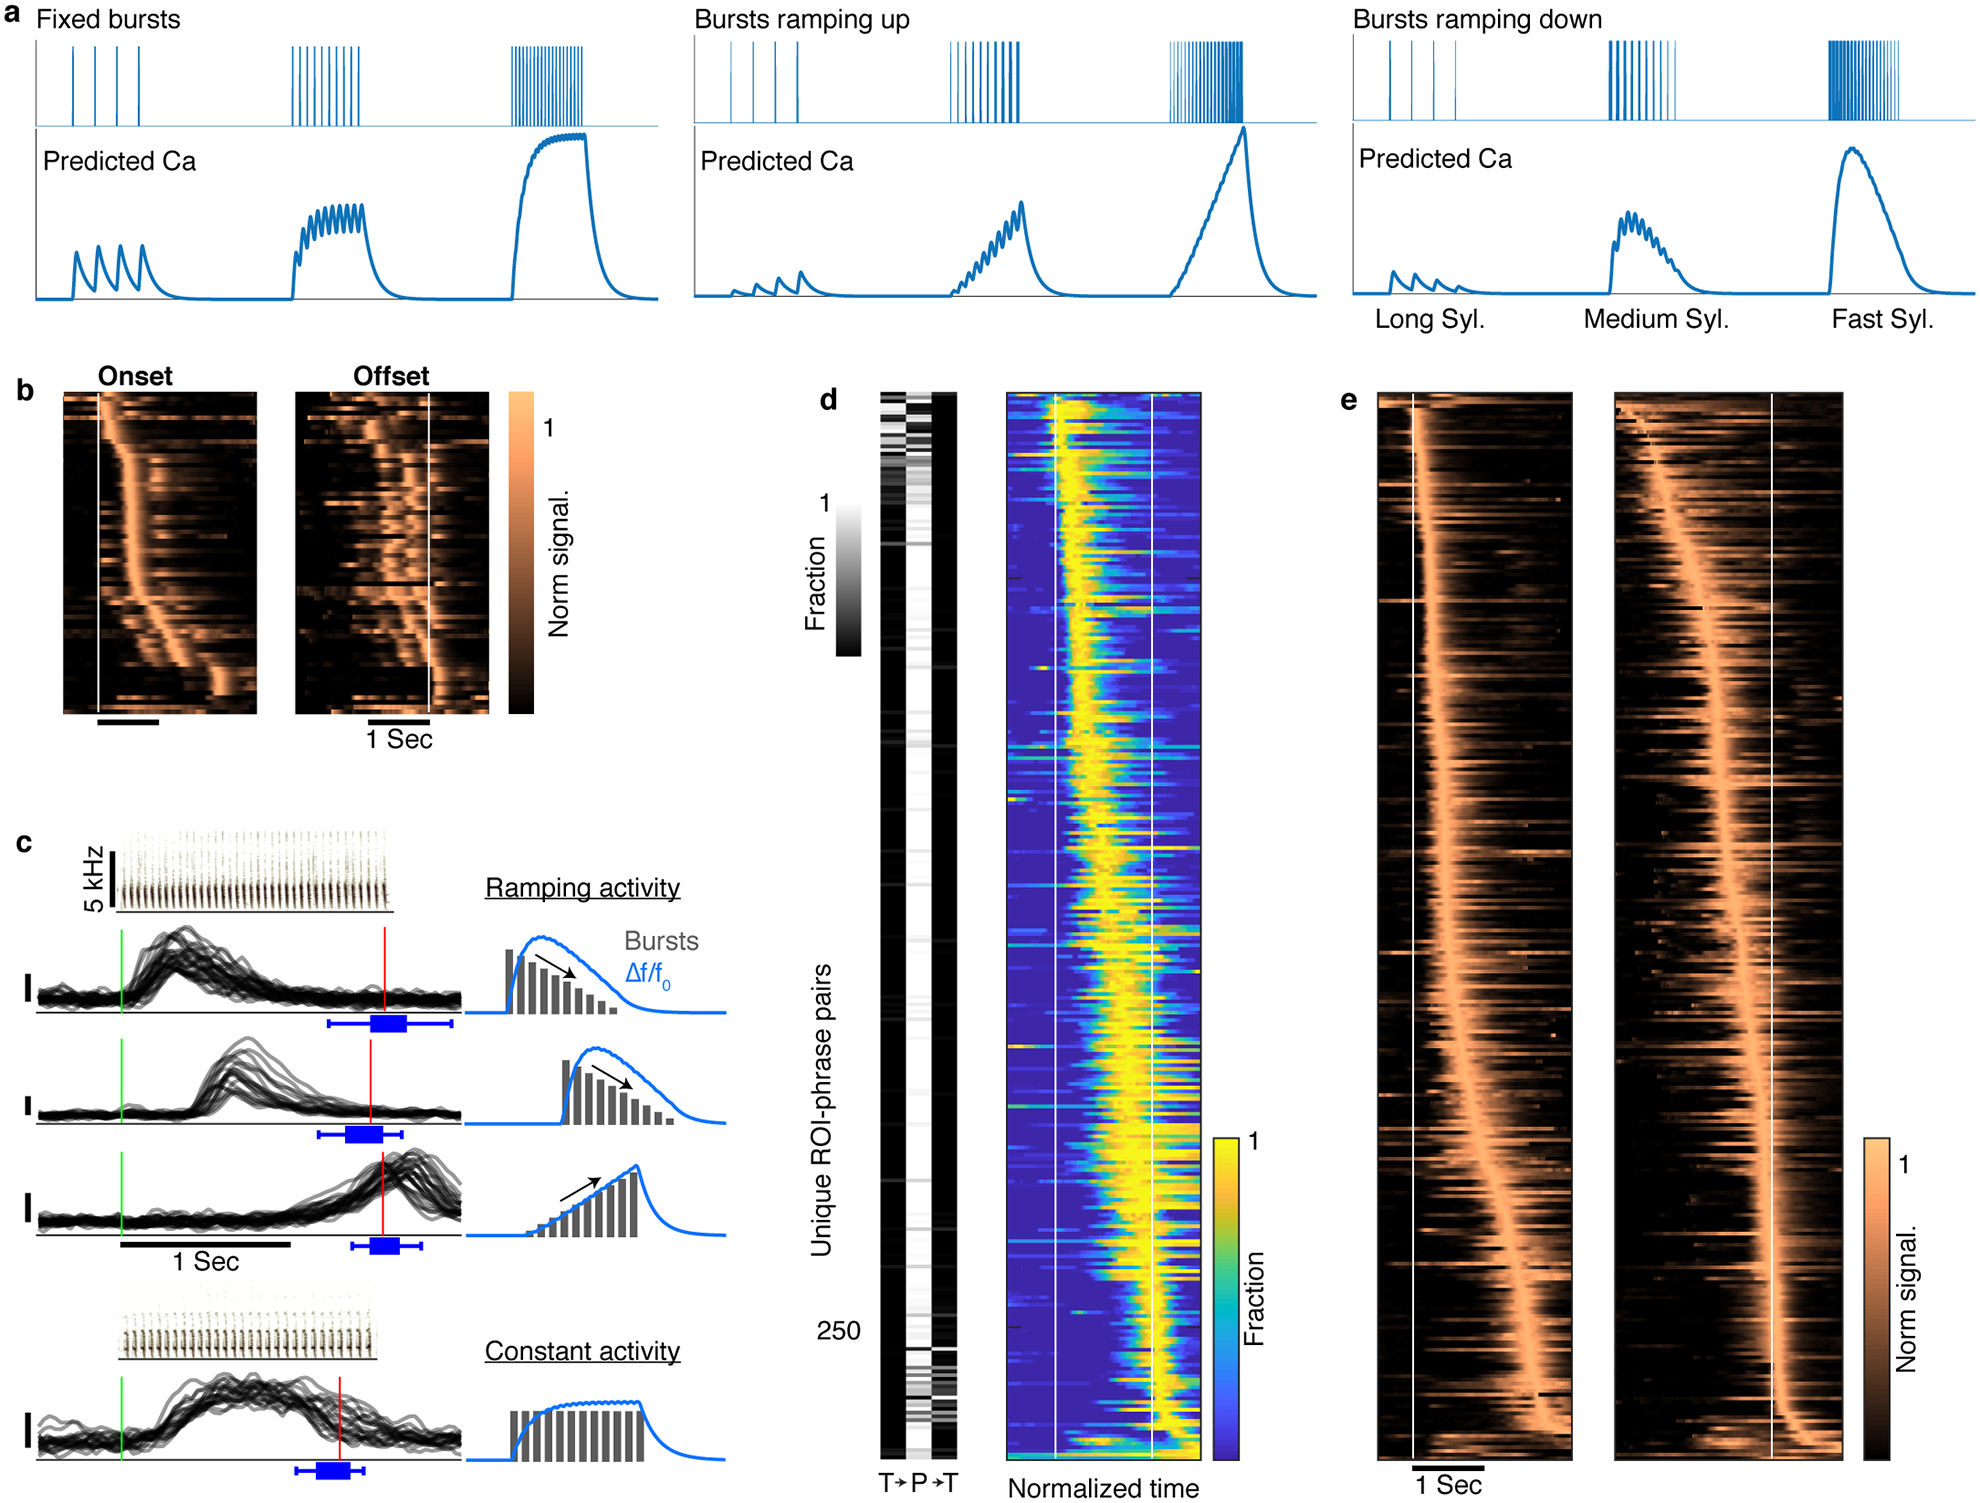
Extended Data Fig. 7 |. Signal shape and onset time of sequence-correlated HVC neurons reflect within-phrase timing.

a. Simulation of calcium indicator (GCaMP6f) fluorescence corresponding to syllable-locked spike bursts in HVC projection neurons. Syllable-locked spike bursts are convolved with the indicator’s kernel (methods) to estimate the expected signal when the number of spikes per burst is constant (left), ramps up (middle), or ramps down (right) linearly with the syllable number. The simulation assumes one burst per syllable in time spacing (x-axis) that matches long canary syllables (400–500msec), medium range syllables (100msec) and short syllables (50msec). b. Complementing Figure 3a, average context-sensitive activity in phrases with long syllables reveals syllable-locked peaks aligned to phrase onsets (left) or offsets (right, same row order as left) that change in magnitude across the phrase. c. Signal shape and onset timing has properties of within-phrase timing codes. Example raw Δf/f0 signals (y-axis, 0.1 marked by vertical bar) of 4 ROIs aligned to onset of specific phrase types (green line, sonograms show the repeating syllables. Red lines and blue box plots show the median, range, and quartiles of the phrase offset timing). The signal shapes resemble the expected fluorescence of the calcium indicator elicited by syllable-locked ramping (sketches, top three) or constant activity. d. Left, barcode show the fraction of signal onsets found in the preceding transition, within the phrase, and in the following transition (T→P→T, methods). Rows correspond to the phrases in Figure 3a. Right, rows show the average signal state occupancy estimated from HMMs fitted to the single-trial data contributing to Figure 3a. The resulting traces are time-warped to fixed phrase edges (white lines). e. The single-trial data in Figure 3a is aligned to phrase onsets (left) and offsets (right) and averaged in real time. The resulting traces are ordered by peak location (separately in left and right rasters).
