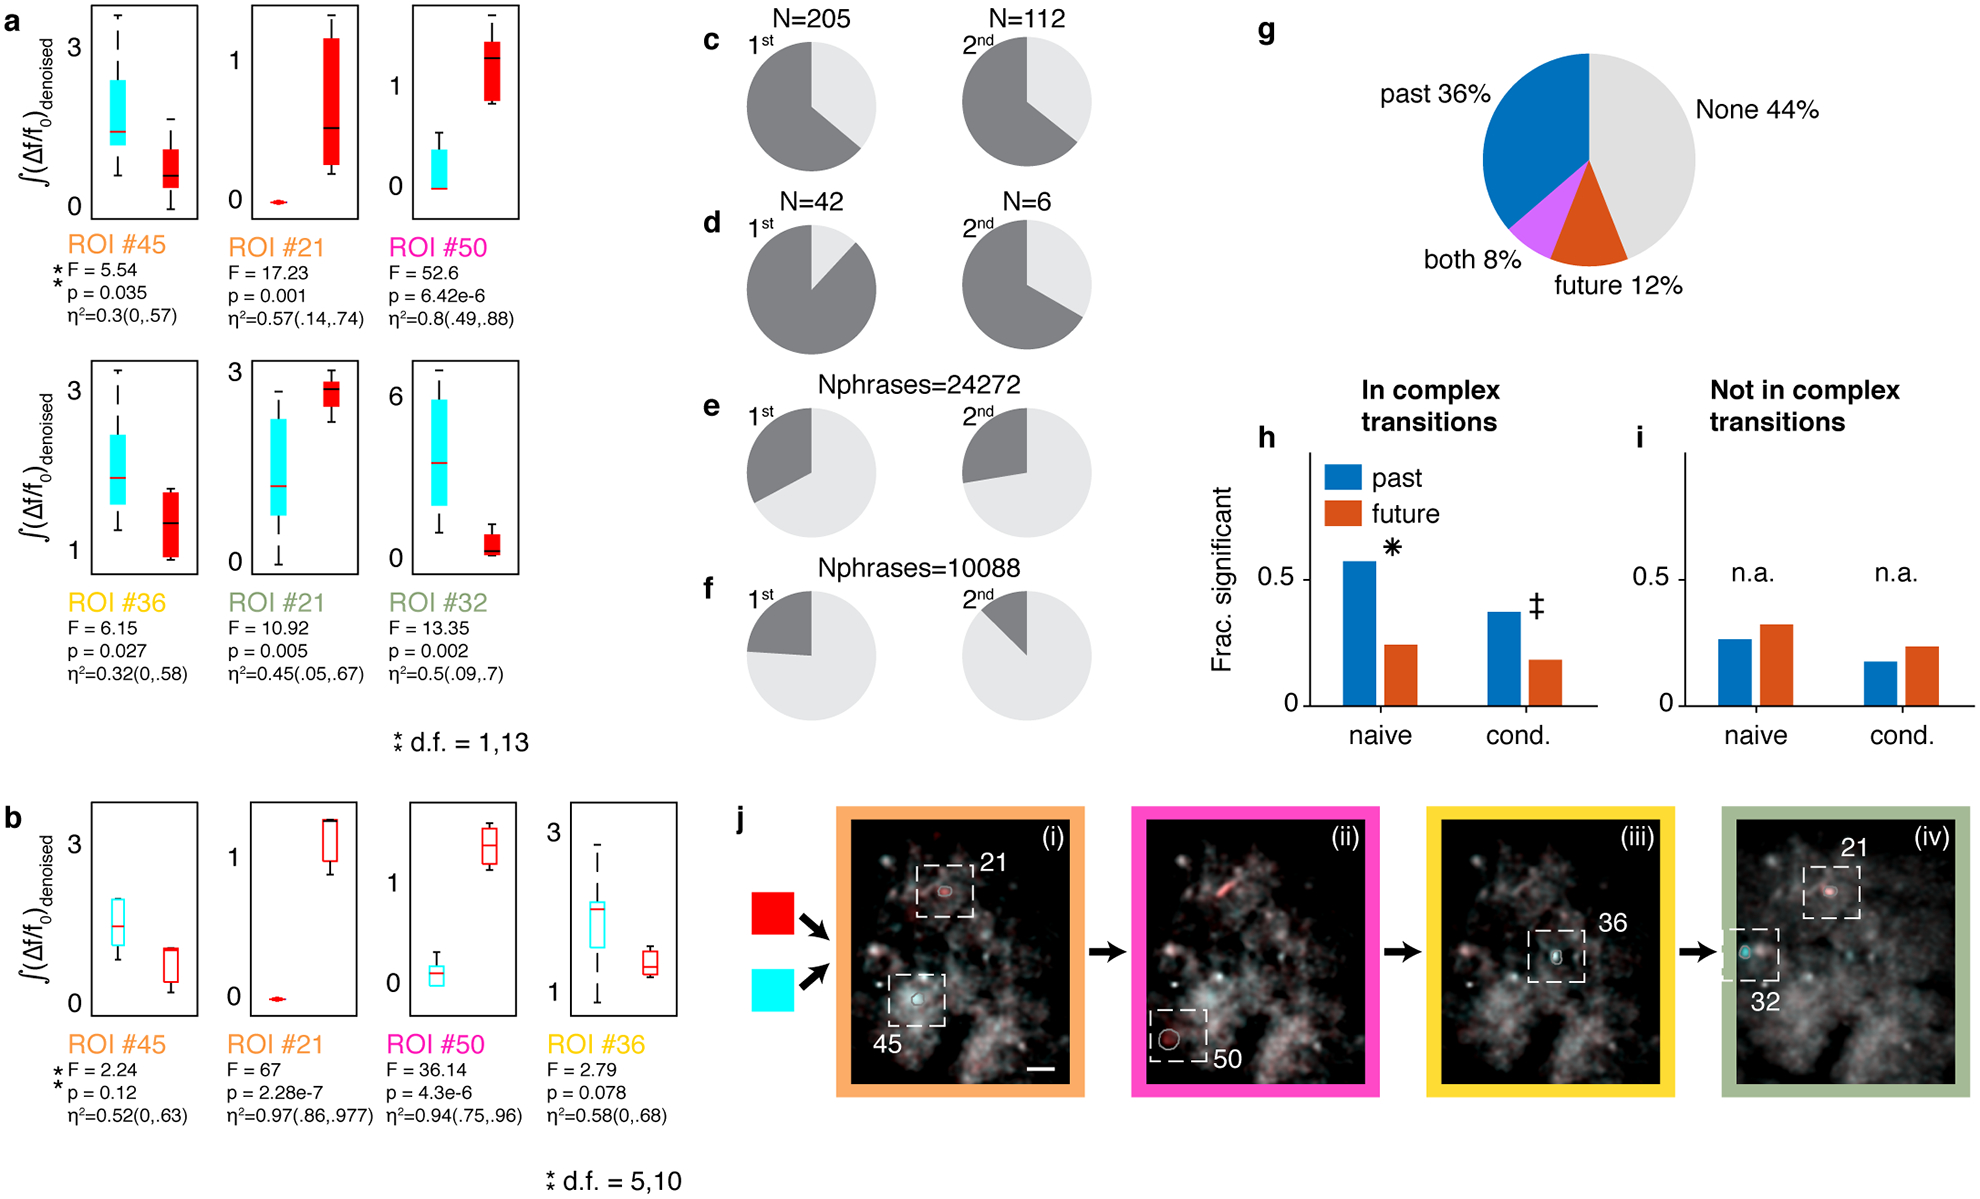
Extended Data Fig. 8 |. Context sensitive signals aggregate in complex transitions and preferentially encode past transitions.

a. Distribution of signal integrals (y-axis, whiskers show full range, boxes show 1st and third quartiles, and lines show the medians) for ROIs in Figure 4a. (Text label is color coded by phrase type in sub-panels i-iv). F-numbers, p-values, and η2 (95% CI) for 1-way ANOVA relating history (x-axis) and signal (y-axis) in N=15 song sequences. b. ROIs in panel (a) retain their song-context bias also for songs that happen to terminate at end of the third phrase rather than continue. Box plots repeat the ANOVA tests in panel (a) for N=16 songs in which the last phrase is replaced by end-of-song. c-f. Dark grey slices indicate the fraction of correlations occurring in complex behavioral transitions. c,d. the data in Figure 4c separated to the two birds. e,f. The fraction in panels c,d expected by the null hypothesis of correlations distributing by the frequency of each phrase type among Nphrases phrases in the dataset. g. In sequence-correlated ROIs, multi-way ANOVA is used to separate the effect of the preceding and following phrase types on the signal (methods). Pie shows the percent of sequence-correlated ROIs significantly influenced by the past, future, or both phrase identities among N=336 significant ANOVA tests. h. Restricting analysis to complex transitions, more ROIs correlated to the preceding phrase type (blue) than to following (red). This is true in both Naive signal values (left, N=185 tests) and after removing dependencies on phrase durations and time-in-song (right, N=185). (one-sided binomial z-test: ✳: proportion difference 0.33 ± 0.09, Z=6.45, p = 5.5e-11, ‡: proportion difference 0.19 ± 0.09, Z=4.05,p = 2e-5). i. Restricting to phrase types not in complex transitions (N=136 ANOVA tests) reveals more ROIs correlated with the future phrase type but the difference is not significant (left,right n.a.: one-sided binomial z-test, p = 0.14,0.11). j. Figure 4a showed maximum projection images, calculated with de-noised videos (methods). The algorithm, CNMF-E49, involves estimating the source ROI shapes, de-convolving spike times as well as estimating the background noise. Here, recreating the maximum projection images with the original fluorescence videos shows the background as well but the preceding-context-sensitive neurons remain the same. Namely, the same ROI footprints annotated in panels i-iv show the color bias (cyan or red) that indicates coding of the past phrase with the same color.
