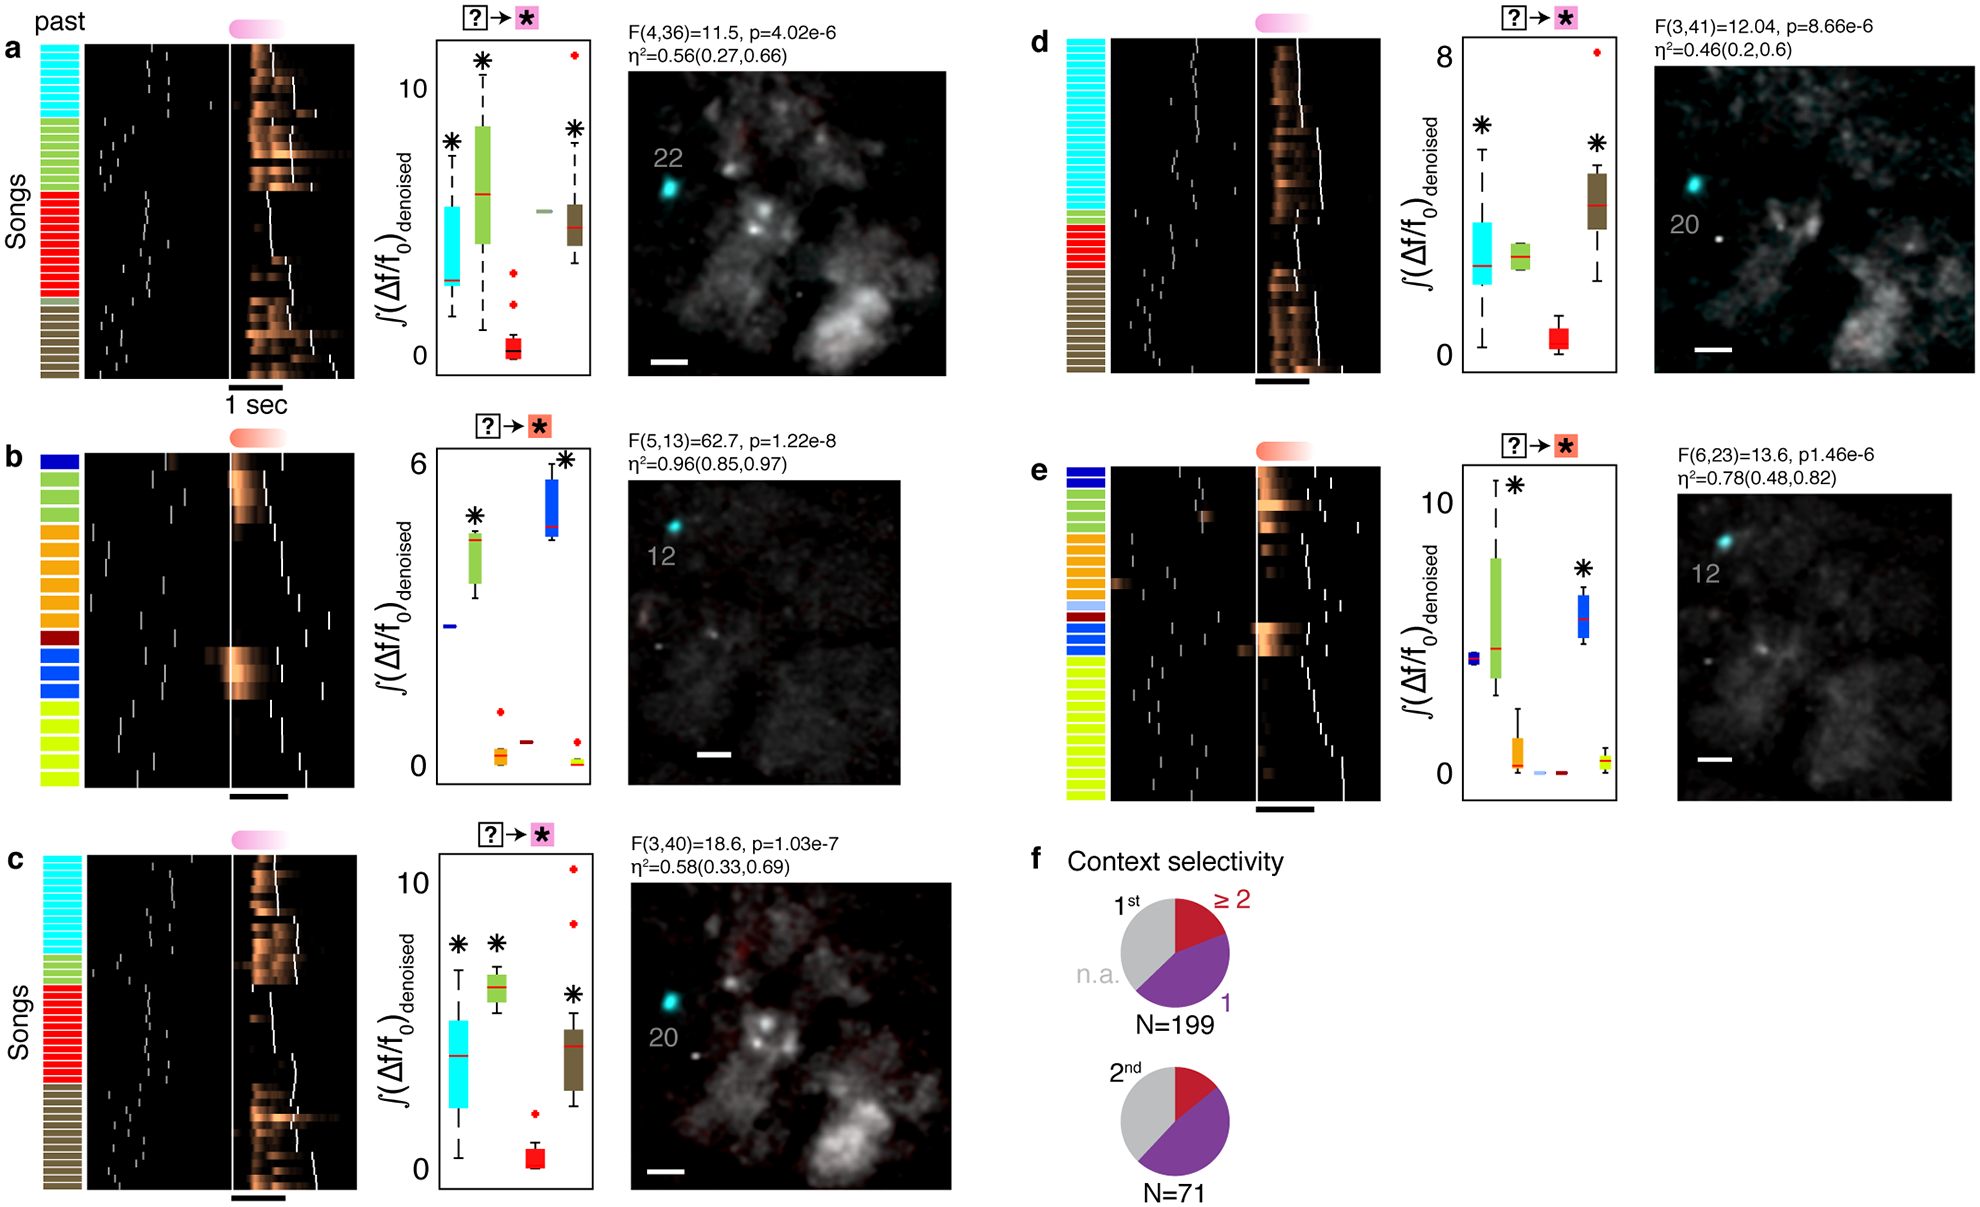
Extended Data Fig. 9 |. ROIs reflecting several preceding song contexts.

a,b. ROIs active in multiple preceding contexts. (Δf/f0)denoised traces are aligned to a specific phrase onset, arranged by identity of preceding phrase (color barcode). White ticks indicate phrase onsets. Box plot shows distributions of (Δf/f0)denoised integrals (y-axis, summation in the phrase marked by ★) for various song contexts (x-axis). F-number, p-value, and effect size (η2(95% CI)) show the significance of separation by song context (1-way ANOVA) and ✳ marks contexts that lead to larger mean activity compared to another context (Tukey’s multiple comparisons, N=41 songs p=0.01,7.5e-6,5.6e-5 in a, N=19, p=8.8e-7,8.15e-8 in b). Average maximum projection images (methods) during the aligned phrase compare the song contexts that lead to significantly higher activity to the other contexts in orthogonal colors (cyan and red for high and low activity). Bar is 50μm. c-e. Neurons with similar context preference like the examples in panels a,b in adjacent days. (Tukey’s multiple comparisons: N=44, p=0.001,4.08e-6,1.3e-6 in c. N=45, p=0.0016,2.85e-6 in d. N=30, p=0.0002,0.0001 in e). f. Fraction of ROIs with selectivity for one context (purple) or multiple contexts (red) identified using Tukey’s post-hoc multiple comparisons (methods). Grey slices (n.a.) mark context-sensitive ROIs for which the post-hoc analysis did not isolate a specific context with larger mean signal. Top (bottom) pie shows selectivity for 1st (2nd) preceding phrases.
