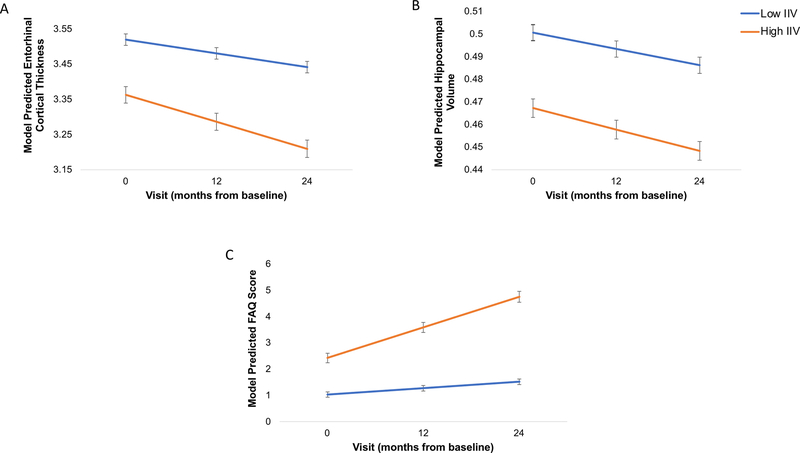
Figure 1.
Baseline IIV Predicts Entorhinal and Hippocampal Atrophy and Functional Decline
Line graphs displaying model predicted values, controlling for age, sex, apolipoprotein E ε4 genotype, PET amyloid-β positivity, and mean level of cognitive performance (and additionally adjusting for education for the model with functional abilities as the depending variable) are shown for (A) entorhinal cortex, (B) normalized hippocampal volume, and (C) Functional Assessment Questionnaire. For visual comparison, the graphs display results for high IIV levels in comparison with low IIV levels which were determined by a median split of the values in the analytic sample (Low = IIV < 0.8195; High = IIV ≥ 0.8195). Lower cortical thickness and hippocampal volume indicate reduced thickness and volume, respectively, (i.e., increasing atrophy). Higher FAQ scores indicate greater functional difficulty. Error bars represent the standard error of the mean.

