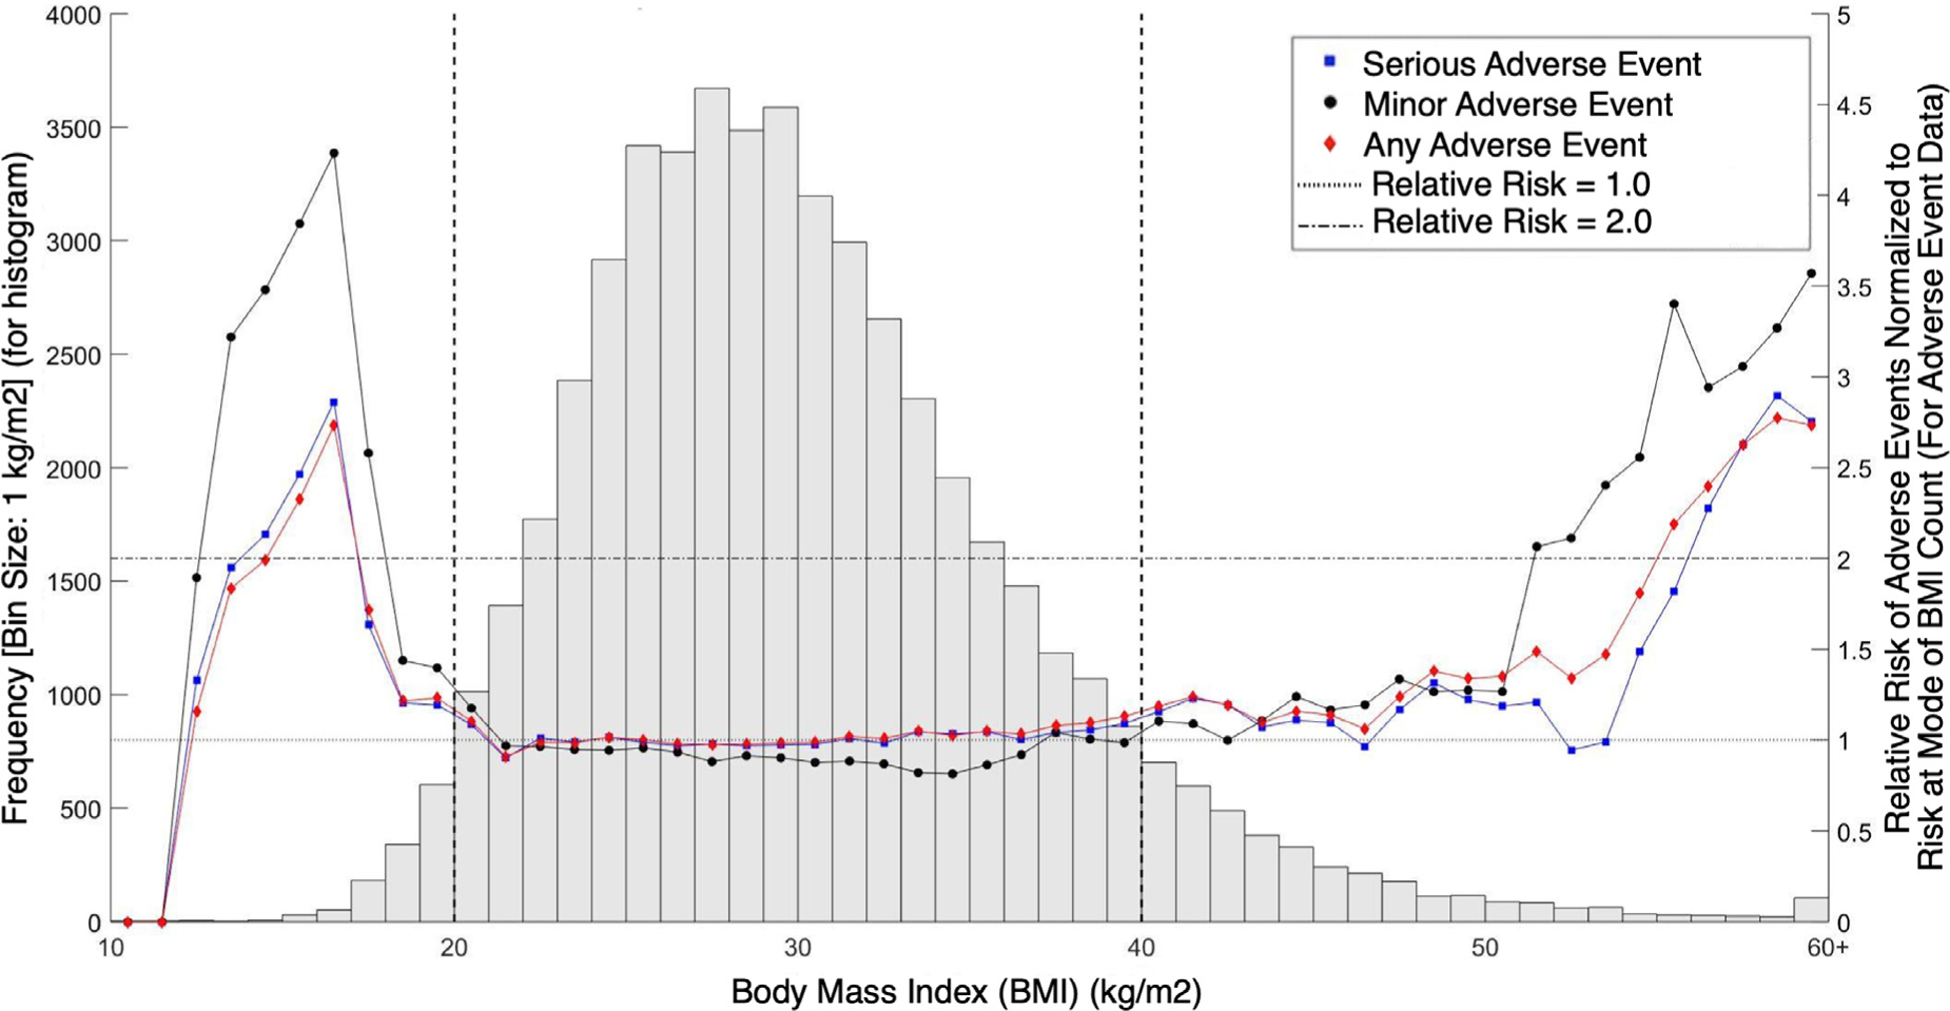
Fig. 2.

Adverse event data as a function of BMI and BMI histogram for patients undergoing anterior cervical procedures. Note: Left y-axis refers to the grey histogram in the figure. Right y-axis refers to the line and scatter plot of adverse event data. Horizontal lines denote relative risks of 1.0 and 2.0 as reference lines. Vertical lines bookend the stable BMI ranges. Blue squares represent major adverse events, black circles represent minor adverse events, red diamond represent any adverse events.
