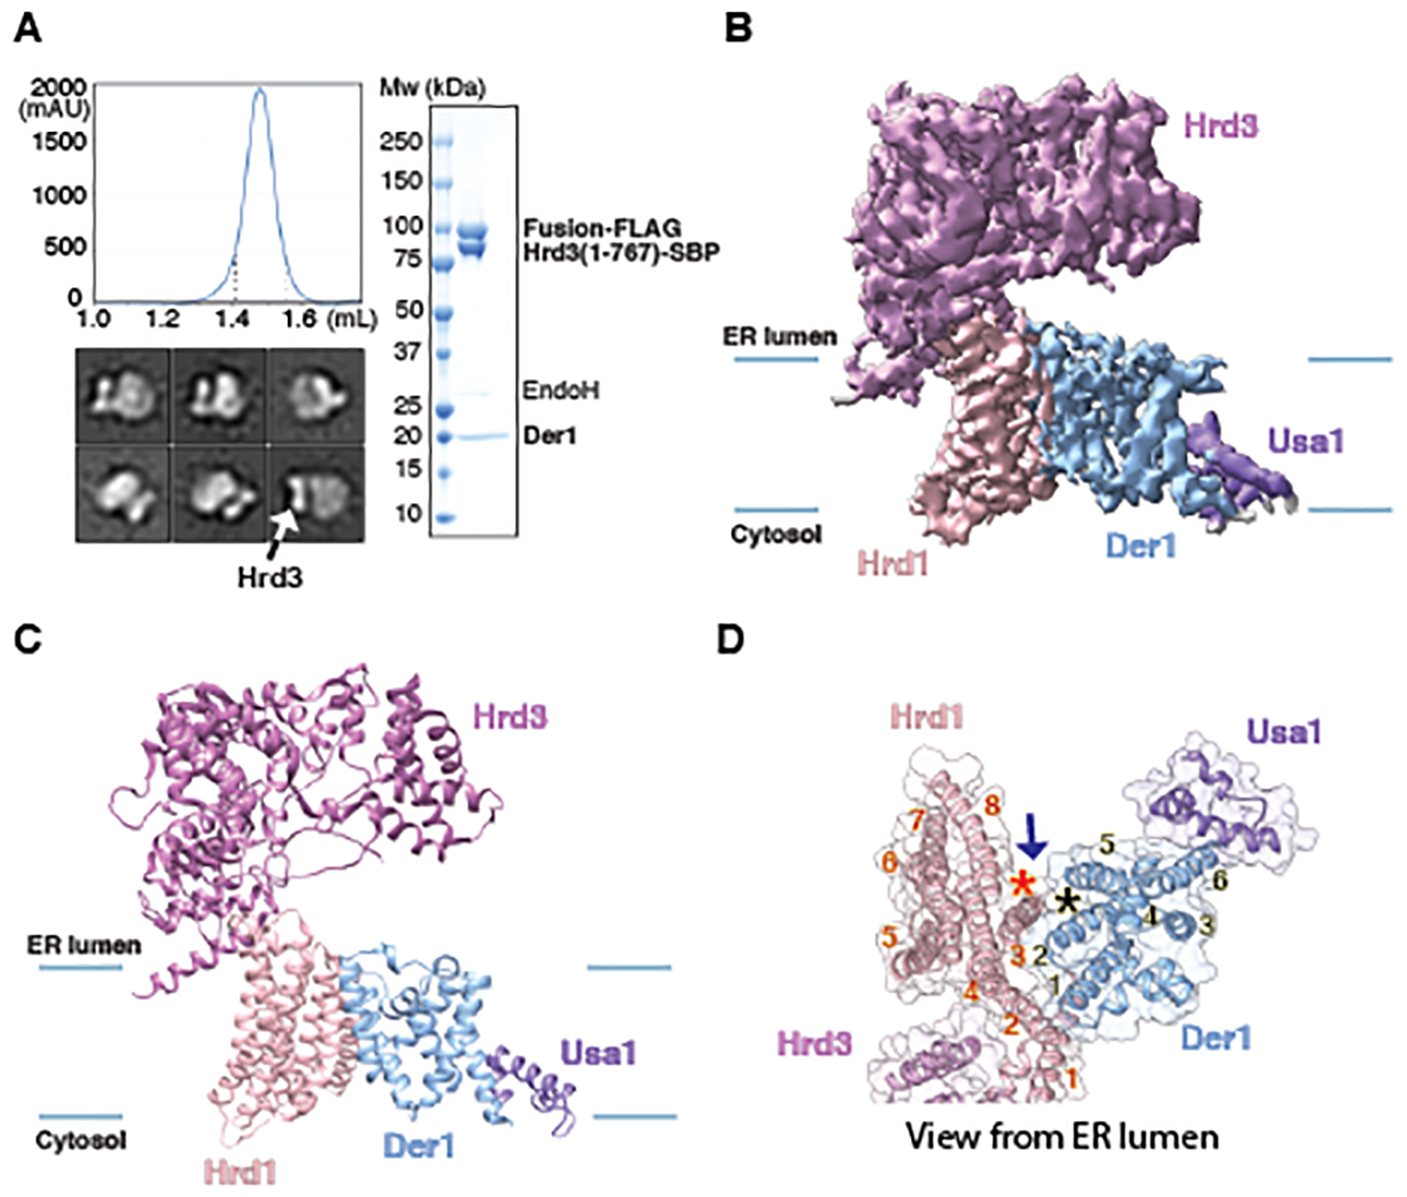
Fig. 2. Cryo-EM structure of the Hrd1~Usa1-Der1-Hrd3 sub-complex.

(A) A FLAG-tagged fusion of Hrd1 and Usa1 was expressed together with SBP-tagged luminal domain of Hrd3 and untagged Der1 in S. cerevisiae cells. The complex was purified with streptavidin- and anti-FLAG- resins and subjected to size-exclusion chromatography. Protein eluting between the dotted lines was pooled and used for EM analysis. The right panel shows a Coomassie-stained SDS-PAGE gel after treatment of the purified sample with endoglycosidase H (Endo H) to allow better separation of Hrd3-SBP and Hrd1~Usa1-FLAG. The left lower panel shows representative 2D averages of negative-stain EM particle images. The box size is 210Å × 210Å. All particles contain one Hrd3 molecule (arrow), which appears as two blobs in some views. (B) Cryo-EM map of the Hrd1~Usa1-Der1-Hrd3 sub-complex in the expected orientation. Shown is a side view with membrane boundaries indicated by blue lines. (C) Side view of models for the Hrd1 complex components in cartoon representation, based on the map shown in (A). (D) As in (C), but for a view from the ER lumen and with the cartoon model embedded in a transparent space-filling model. TMs of Hrd1 and Der1 are numbered. The stars indicate the lateral gates of Hrd1 and Der1 and the arrow shows how lipid molecules could reach the gates.
