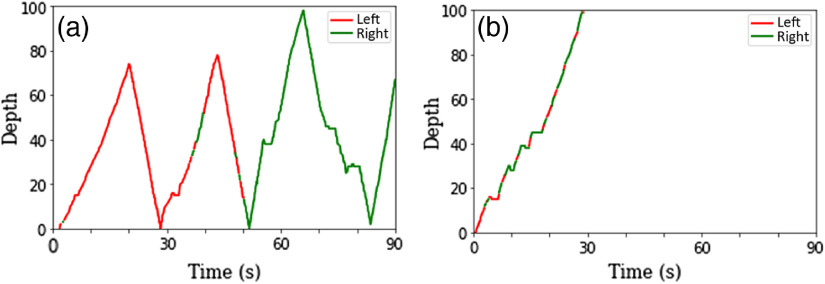
Fig. 2.
Depth (slice number in the direction) versus time plot example for typical (a) driller and (b) scanner. In this example, the number of courses per trial was 7 for the driller-like reader and 1 for the scanner-like reader. Colors indicate which part of the liver was analyzed by the reader. For driller, each part was individually fixated while scrolling, and for scanner both parts, left and right liver were alternatively fixated while scrolling.

