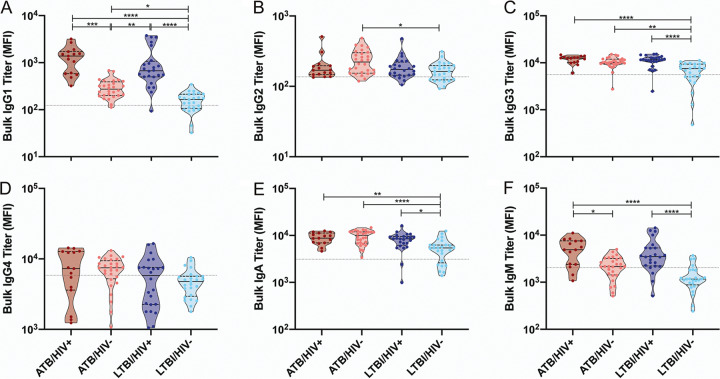
FIG 1.
Bulk immunoglobulin levels are increased during HIV and M. tuberculosis infection. Relative levels of bulk IgG1 (A), IgG2 (B), IgG3 (C), IgG4 (D), IgA (E), and IgM (F) present in the plasma of the study population and negative controls were determined via Luminex. The median fluorescence intensity (MFI) for each individual is graphed. The gray dotted lines is the median of the control group. Within each violin plot, the black solid line is the median and the black dashed lines show the interquartile range. Kruskal-Wallis with Dunn’s multiple-comparison test was used. Adjusted P values are as follows: *, P < 0.05; **, P < 0.01; ***, P < 0.001; ****, P < 0.0001.

