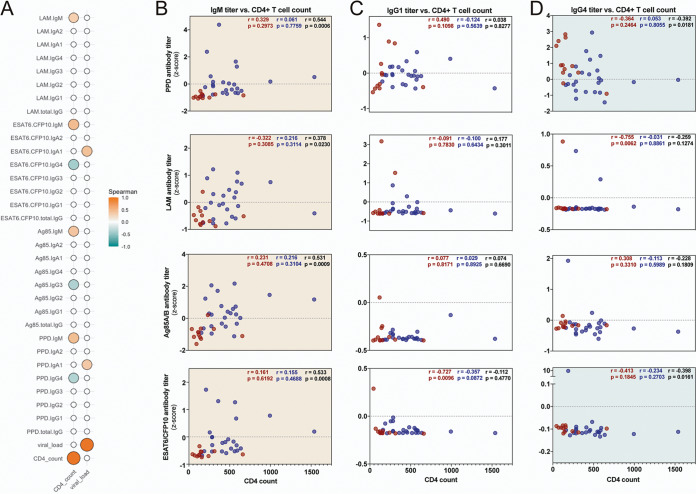
FIG 4.
Antigen-specific IgM and IgG4 titers correlate with CD4+ T cell counts. (A) Spearman correlations across all HIV+ individuals comparing CD4+ T cell counts and viral loads to Z-scored antigen-specific isotype and subclass titers. Statistically significant correlations (P < 0.05) are indicated by the filled circles. The size and color of each correlation circle corresponds to the strength of the relationship. Correlations with P value of >0.05 are empty, white circles. (B to D) Correlation plots of selected IgM (B), IgG1 (C), and IgG4 (D) data from panel A. Each dot represents an individual, with ATB/HIV+ in red and LTBI/HIV+ in blue. In the top right of each graph, Spearman r and P values are indicated for ATB/HIV+ (red), LTBI/HIV+ (blue), and total HIV+ (black). The background of each graph is colored to indicate the significance and directionality of the correlation across all HIV+ individuals. Orange, significant positive correlation; teal, significant negative correlation; white, nonsignificant correlation.

