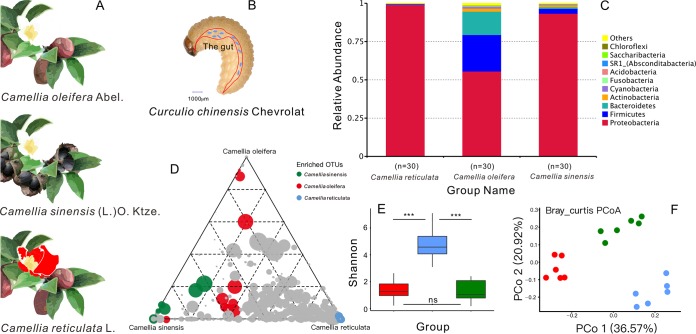
FIG 4.
Basic information of the three host plants, the larvae of Curculio chinensis Chevrolat, and the gut microbial community of CW larvae feeding on the three host plants. (A) Three host plants of Camellia. (B) Physical characteristics of CW larvae. (C) Phylum-level distribution of gut microbiota of CW larvae feeding on the three Camellia species. (D) Ternary plot depicting all OTUs (>5‰) found in CW larvae from the three host plants (n = 18). Each point corresponds to an OTU. The position of each point represents the RA of the OTU with respect to each compartment, and the size of each point represents the RA (weighted average) across all three compartments. Colored points represent OTUs enriched in one compartment compared with the others (green for C. sinensis group, blue for the C. reticulata group, and red for the C. oleifera group), whereas gray points represent OTUs that are not significantly enriched in a specific compartment. (E) Shannon index analysis based on unweighted UniFrac distance for the three host plant samples. The horizontal bars within boxes represent medians. The tops and bottoms of the boxes represent the 75th and 25th percentiles, respectively. The upper and lower whiskers extend to data no more than 1.5× the interquartile range from the upper edge and lower edge of the box, respectively. ***, P < 0.001; ns, nonsignificant. (F) Principal-coordinate analysis plot of 16S rRNA gene weighted Bray-Curtis distances for the three host plant samples (P < 0.001, permutational multivariate analysis of variance [PERMANOVA] by Adonis).

