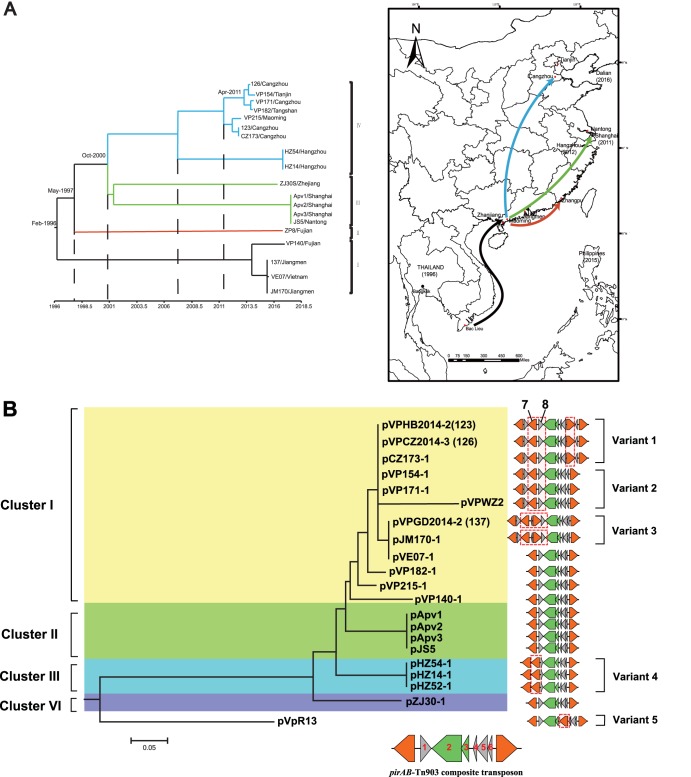
FIG 2.
(A) Maximum likelihood (ML) phylogeny of the 19 ST415 genomes studied and their geographic distribution. The tips of the tree are colored to indicate the transmission events. The year of isolation is indicated below. Red points indicate the isolation sites in this study, and black points indicate the isolation sites recorded in the PubMLST database. (B) ML phylogeny of the pirAB-positive plasmids from ST415 strains. The variant number of each plasmid is indicated on the right side of the tree. Tn6264 consisting of six genes (namely, genes 1 to 6) and two identical insertion sequences named ISVal1 are located under the tree. The insertion of the redundant ISVal1 is labeled as a dashed line.

