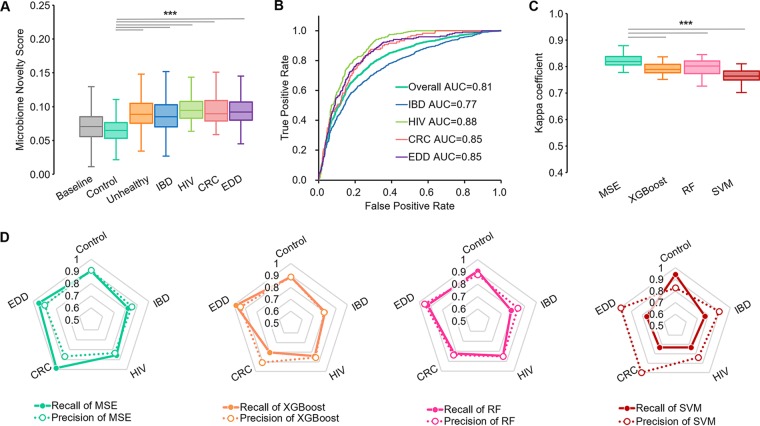
FIG 2.
Microbiome search-based disease status detection and classification. (A) MNS of gut samples from patients (IBD, HIV, CRC, EDD, or their pools) are significantly different from those of samples from healthy subjects. (B) Receiver operating characteristics (ROCs) of MSE-based disease prediction. (C) Comparison of MSE-based and model-based (XGBoost, RF, and SVM) methods for performance via Kappa coefficients. (D) Recall and precision of MSE versus models for each cohort. Each vertex of the pentagon represents a recall/precision value on a specific disease, and thus, collapse on any vertex reflects shortcoming of the method in detecting the corresponding disease. For boxplots in A and C, central lines represent the medians, the bounds of the box represent the quartiles, and error bars represent the local maximum and local minimum values. ***, P < 0.01. Source data are provided as Data Set S1.

