
FIG 5.
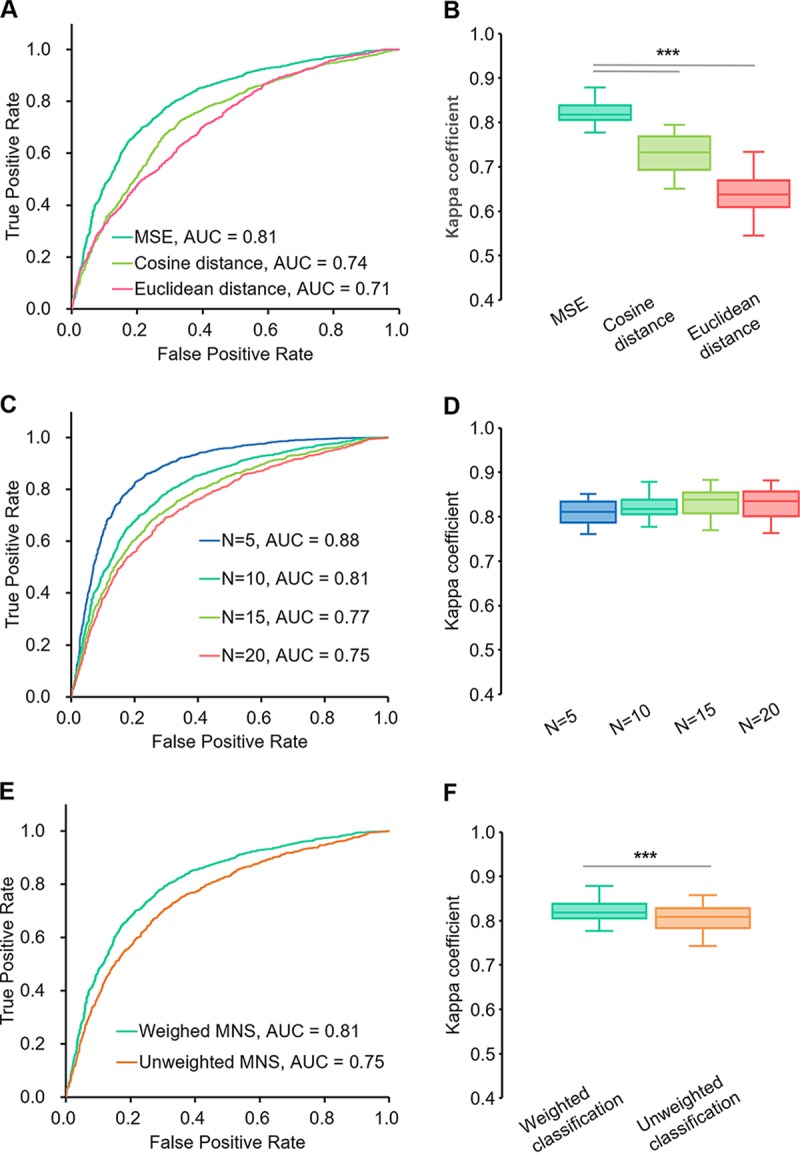
Search parameters that influence the performance of MSE-based disease detection and classification. (A) ROCs of MNS-based disease status detection in MSE step I based on different distance metrics. (B) Kappa coefficients (k) of multiple-disease classification in MSE step II based on distinct distance metrics. (C) ROCs of MNS-based disease status detection in MSE step I based on different numbers of matches. (D) k of multiple-disease classification in MSE step II based on distinct numbers of matches. (E) ROCs of MNS-based disease status detection based on weighted or unweighted MNS. (F) k of multiple-disease classification based on weighted or unweighted classification. For boxplots in B, D, and F, central lines represent the medians, the bounds of the box represent the quartiles, and error bars represent the local maximum and local minimum values. ***, P < 0.01. Source data are provided as Data Set S1.