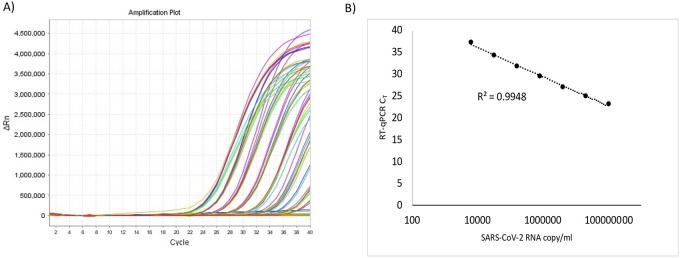
Fig 1. Linearity of SARS-CoV-2 RT-qPCR by direct approach.
A tittered SARS-CoV-2 positive nasopharyngeal specimen was serially diluted using a negative specimen, pre-heated at 65°C for 10 min and assessed by SARS-CoV-2 RT-qPCR as described in the Supplemental methods. A) Amplification curves from SARS-CoV-2 RT-qPCR assay on the serially diluted sample. B) RT-qPCR CT values were plotted against estimated copy number of SARS-CoV-2 RNA in each dilution. Each data point represents an average of data obtained from 8 replicates.

