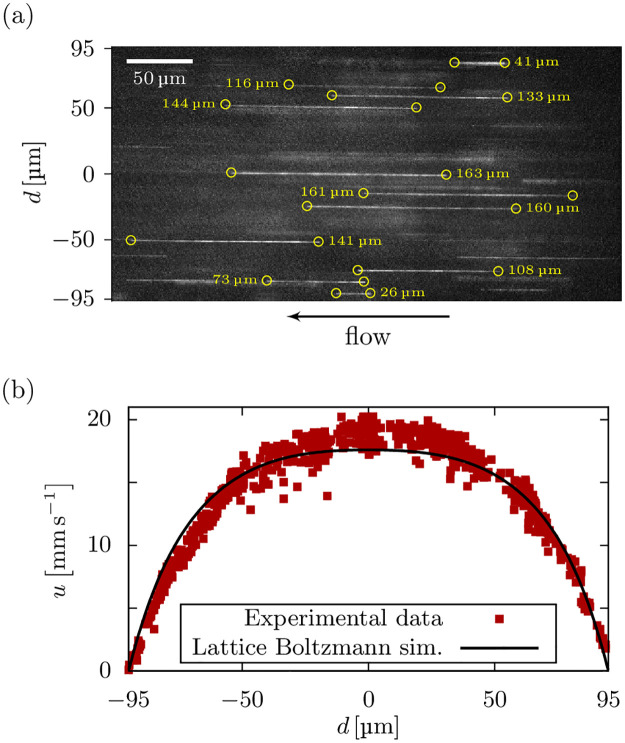
Fig 4. Validation with experimental flow measurements.
Experimental measurement of the flow profile of a 2% alginate solution in a 190 μm × 190 μm microchannel. (a) Example micrograph of the bead tracking procedure. The velocity with respect to the lateral position is obtained as the length (yellow circles and labels) of the streaks divided by the exposure time. (b) The measured flow profile is in excellent agreement with our Lattice Boltzmann simulations.

