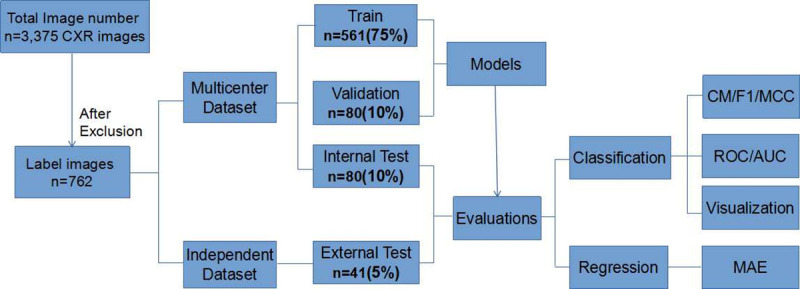
Fig 1. Workflow diagram illustrating the overall experimental design.

It described the flow of CXR images through labeling process followed by training transfer learning models using multicenter data and evaluating the models with internal multicenter testing data and independent external testing data. The labeled images were chosen from the initial total dataset according to diagnostic criteria and sufficient quality. CM, confusion matrix; MCC, Matthews correlation coefficient; ROC, receiver operating characteristic; AUC, the area under the curve; MAE, mean absolute error.
