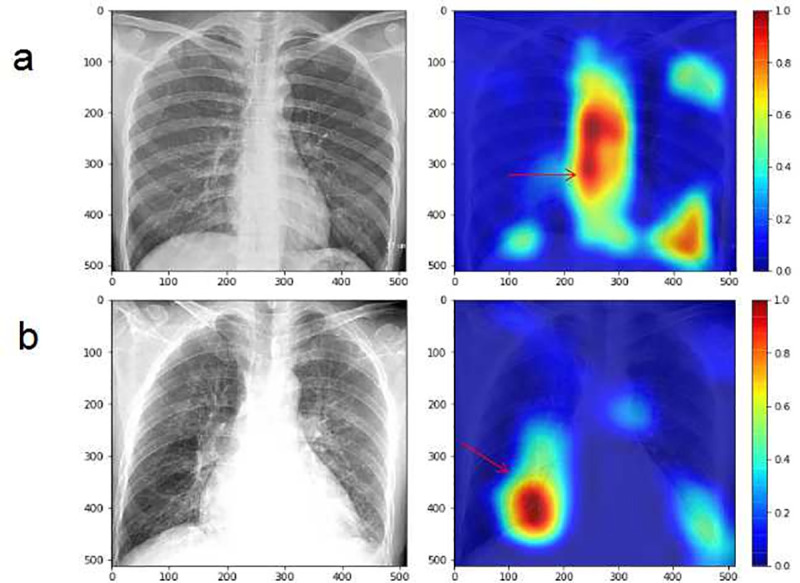
Fig 6. Visualization of CNN models using Grad-CAM to classify PH from normal based on radiograph images.

The highlighted areas indicatied by red arrows are discriminative features for identification of PH. The Grad-CAM of patient without PH (a). The Grad-CAM of patient with PH (with PASP of 56mmHg) (b). CNN, Convolutional Neural Network; PH, pulmonary hypertension; Grad-CAM, Gradient Class Activation Map; PASP, pulmonary artery systolic pressure.
